- Nilfisk’s business structure shows why commercial cleaning is different from consumer appliances.
- Aftersales, floorcare equipment and regional organization are central to professional cleaning profitability.
- The 2018 restructuring highlighted how global cleaning equipment companies optimize factories and product lines.
Danish industrial cleaning equipment giant Nilfisk (Lirchi) released its annual report for 2018, and I have briefly excerpted some of the information for reference.
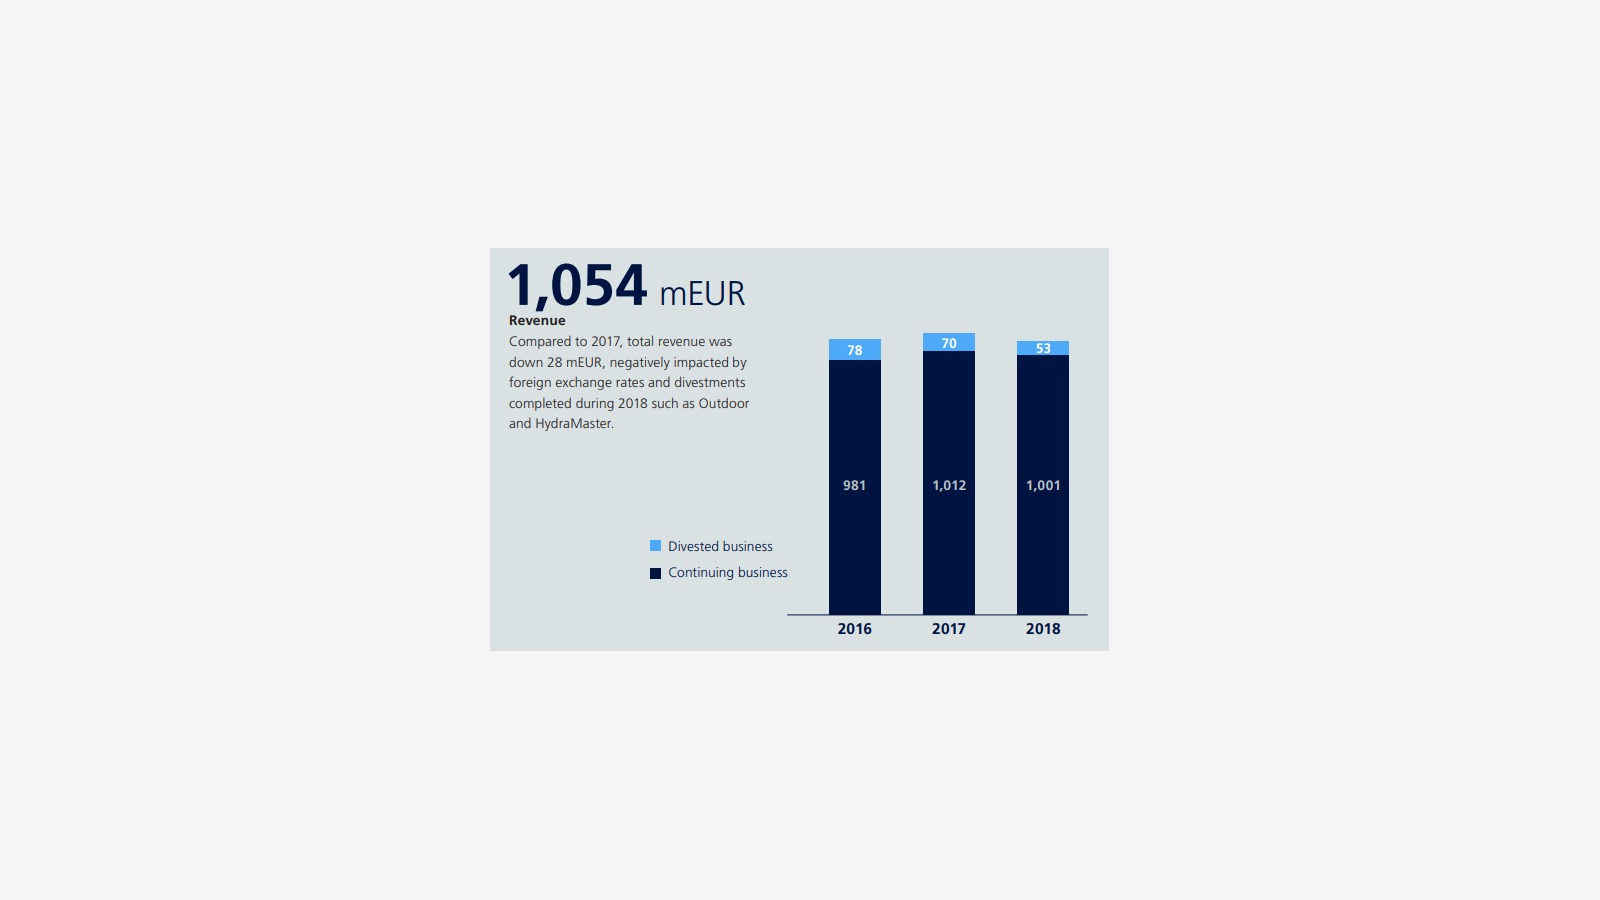
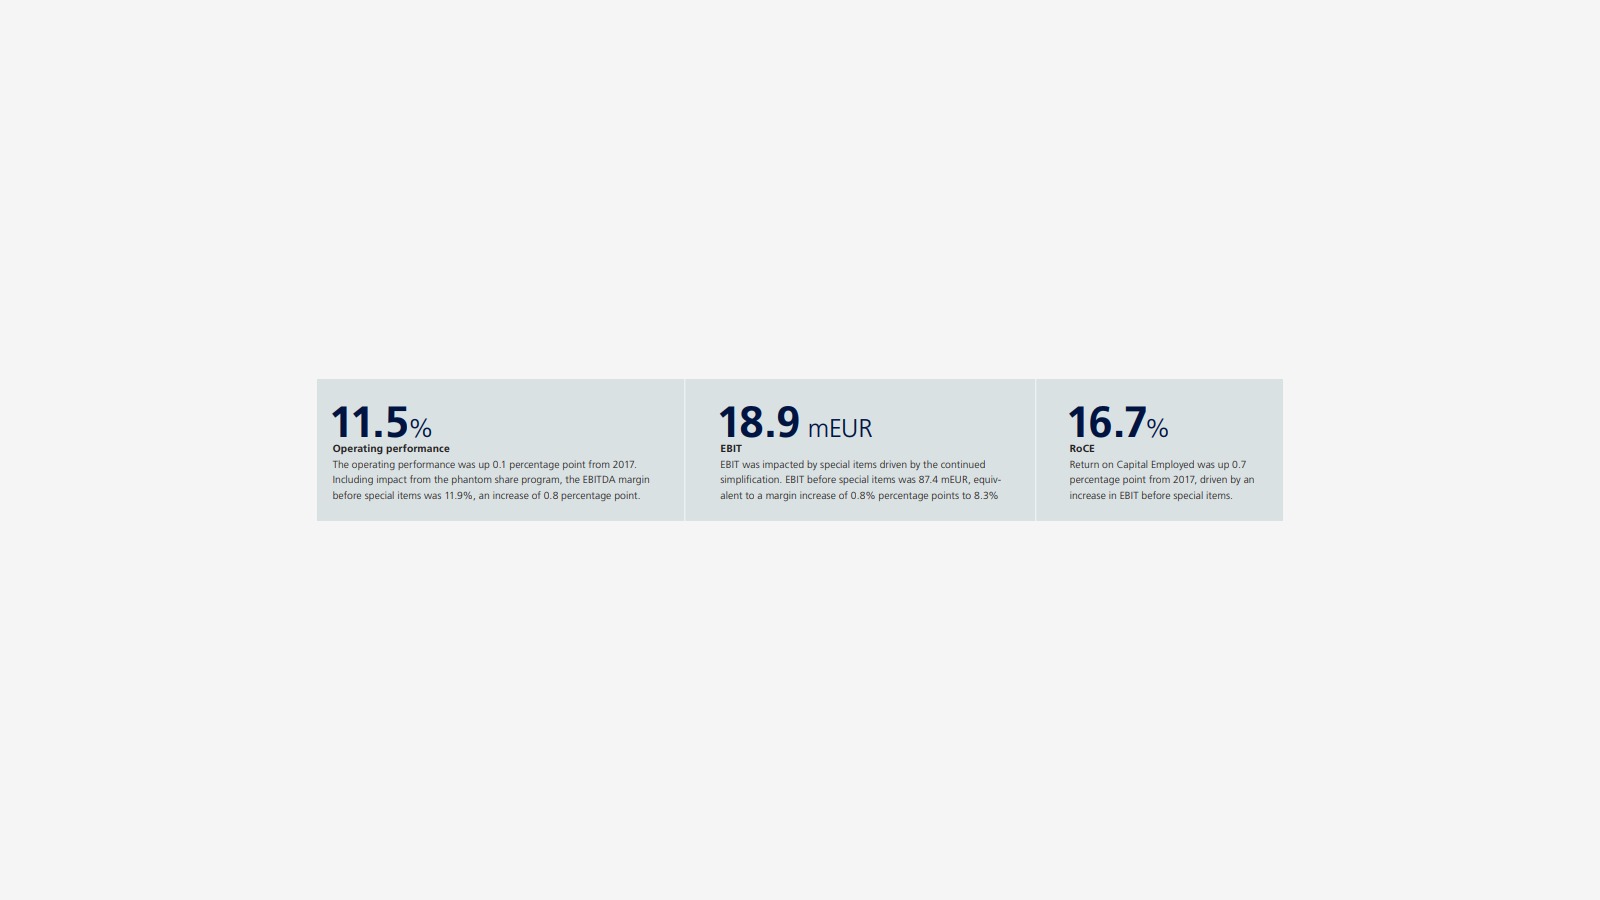
Sales in 2018 amounted to 1.054 billion euros, with operating profit increasing by 11.5% compared to 2017.
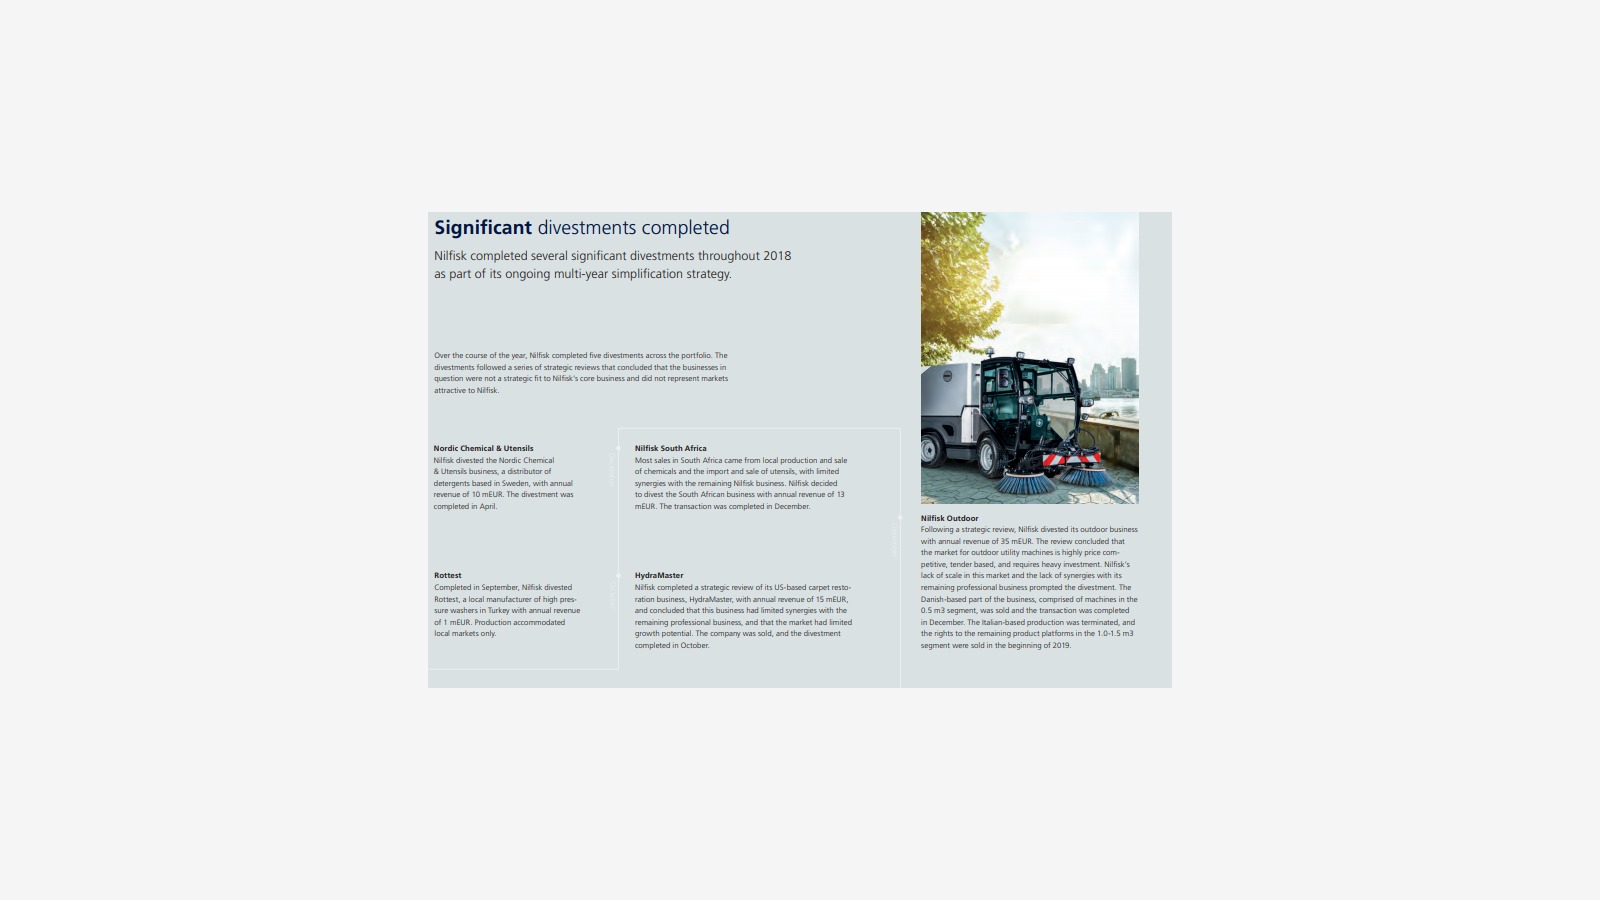
In 2017, the following parts were separated:
Noridic Chemical & Utensils with an annual turnover of approximately €10 million
Nilfisk South Africa with an annual turnover of about €13 million
Turkish high-pressure cleaning machine manufacturer Rottest, with an annual turnover of around €1 million
U.S. carpet cleaning business Hydramaster, with an annual turnover exceeding €15 million
Nilfisk Outdook (outdoor business) with an annual turnover exceeding €35 million.
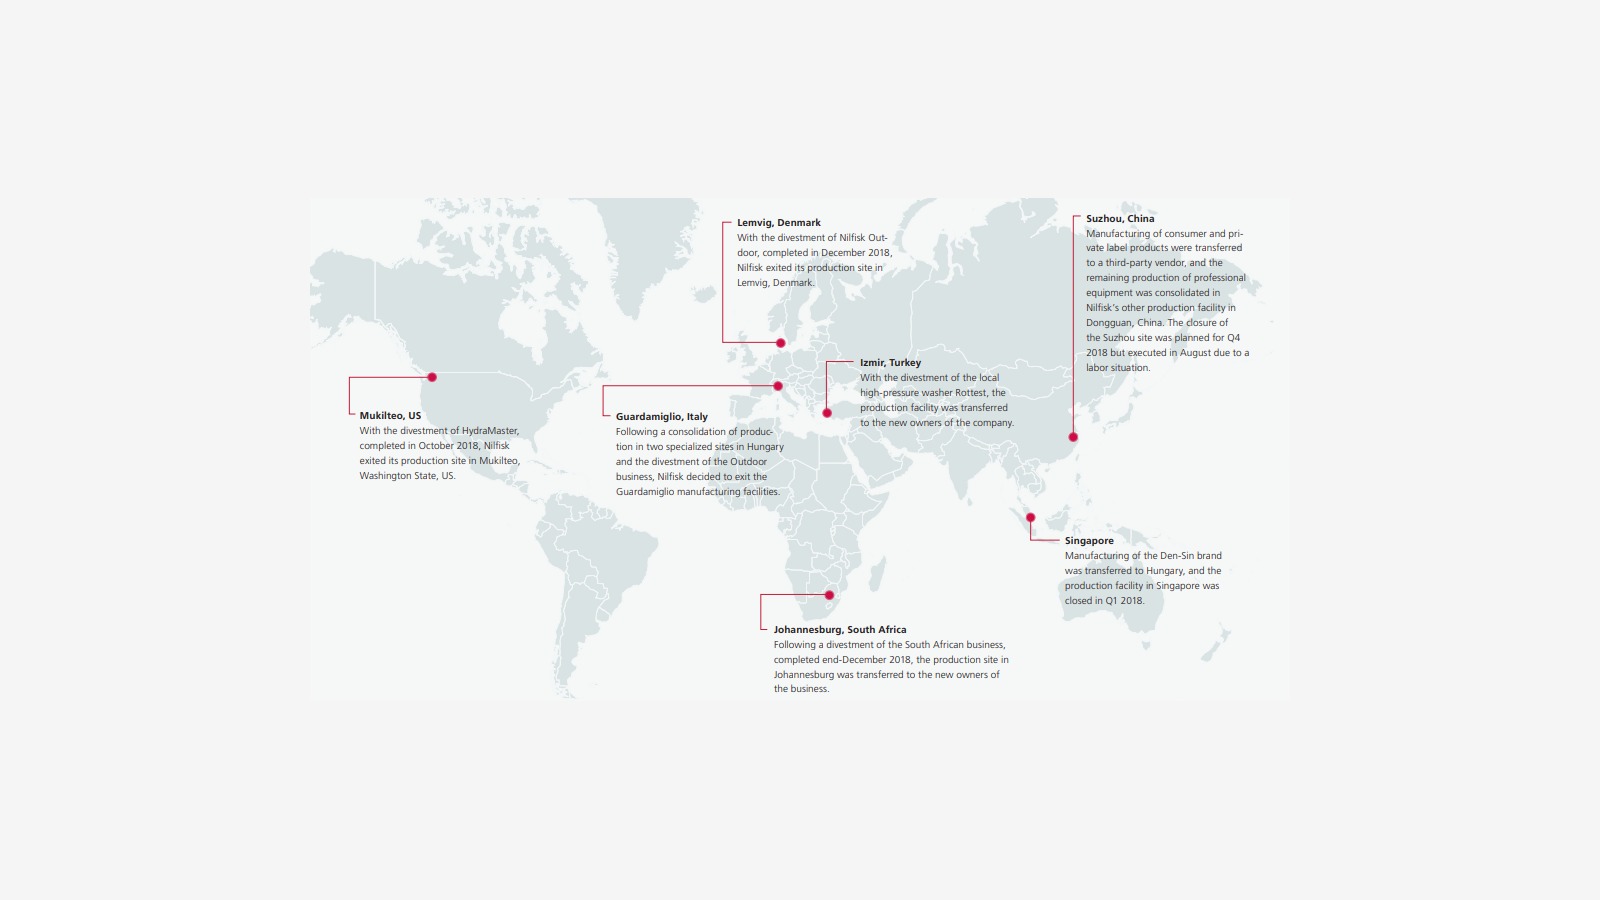
Closed 7 factories:
United States Mukilteo factory (Hydramaster business), Italian Guardamiglio factory (outdoor product business), Turkish Izmir factory (high-pressure cleaning machines), South African Johannesburg factory, Chinese Suzhou factory business transferred to Dongguan, Singapore Den-sin factory.
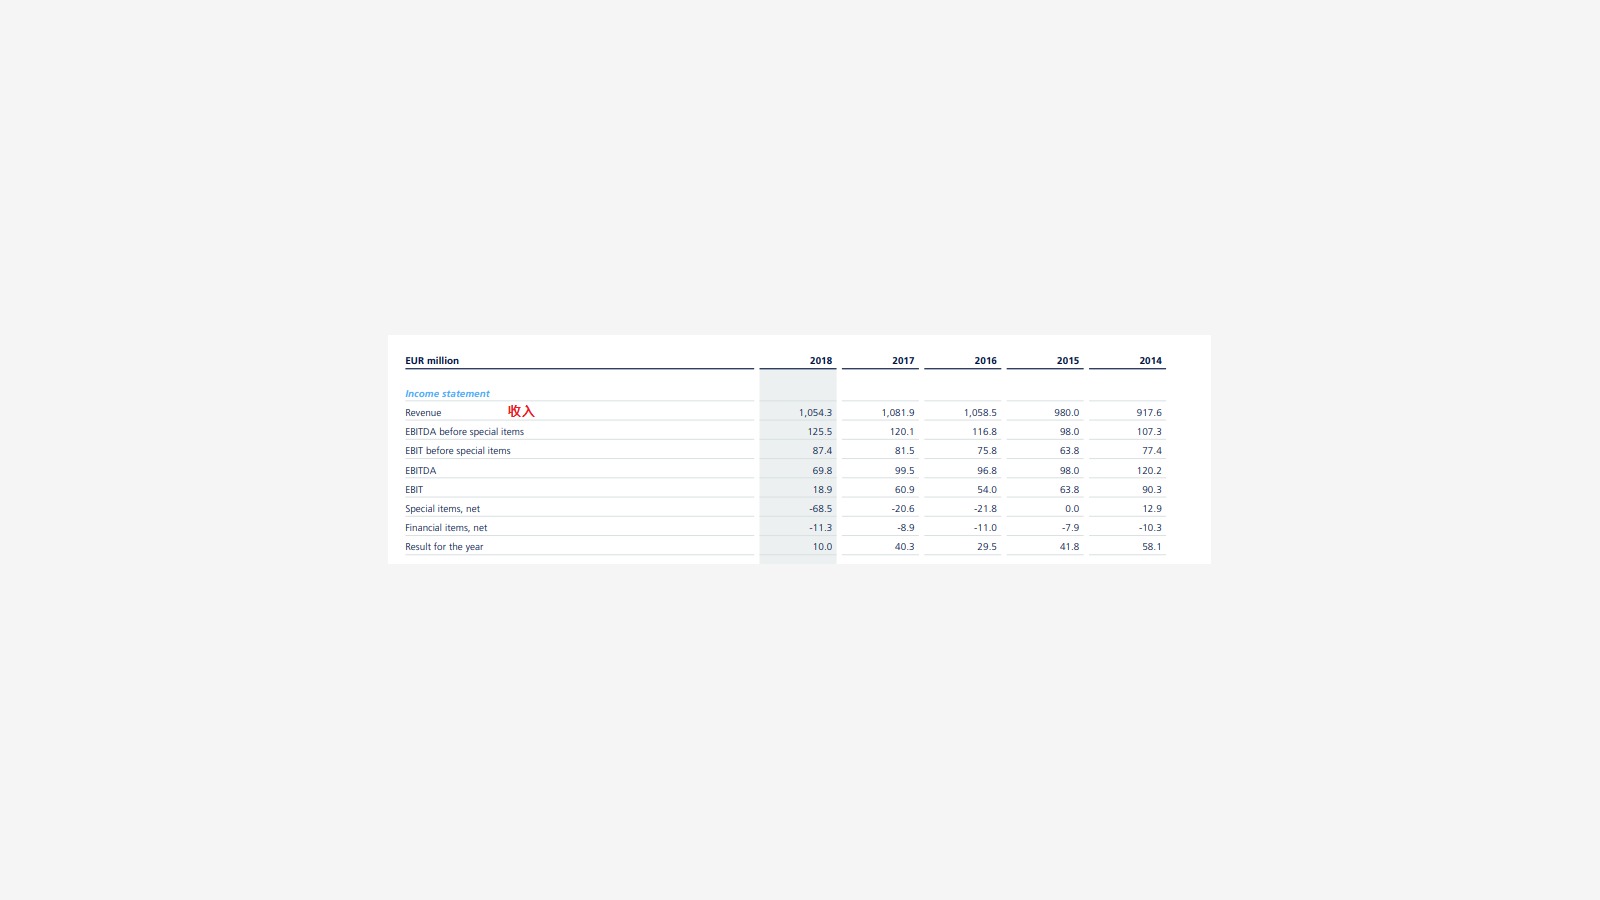
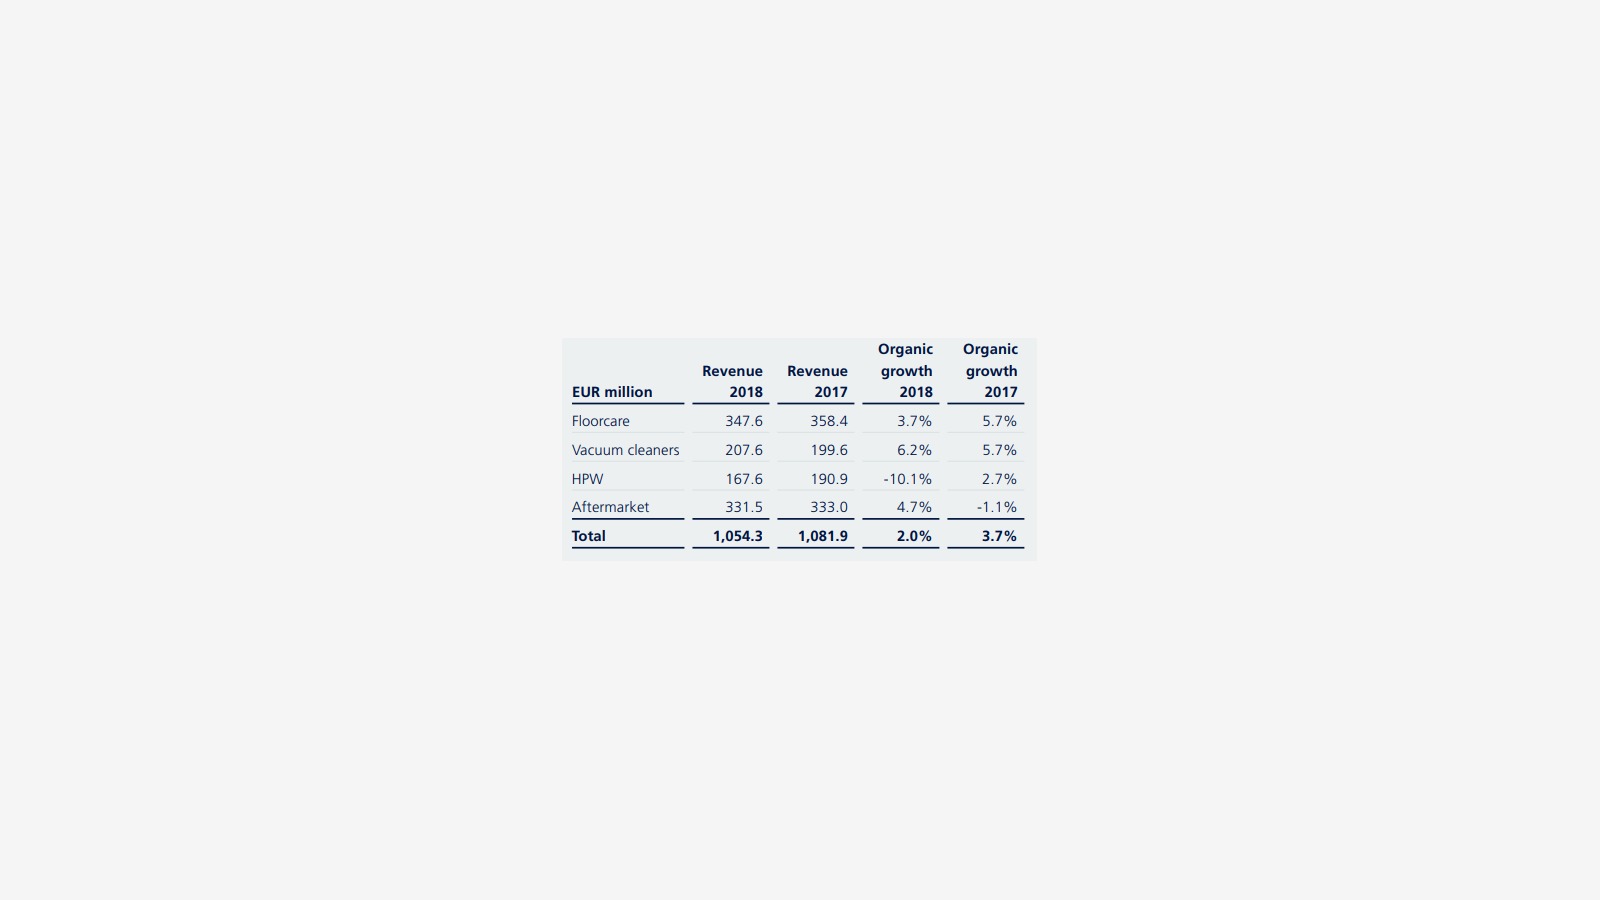
Sales in 2018 were 1.0543 billion euros, 2017 was 1.0819 billion euros, 2016 was 1.0585 billion euros, 2015 was 0.980 billion euros, and 2014 was 0.9176 billion euros.
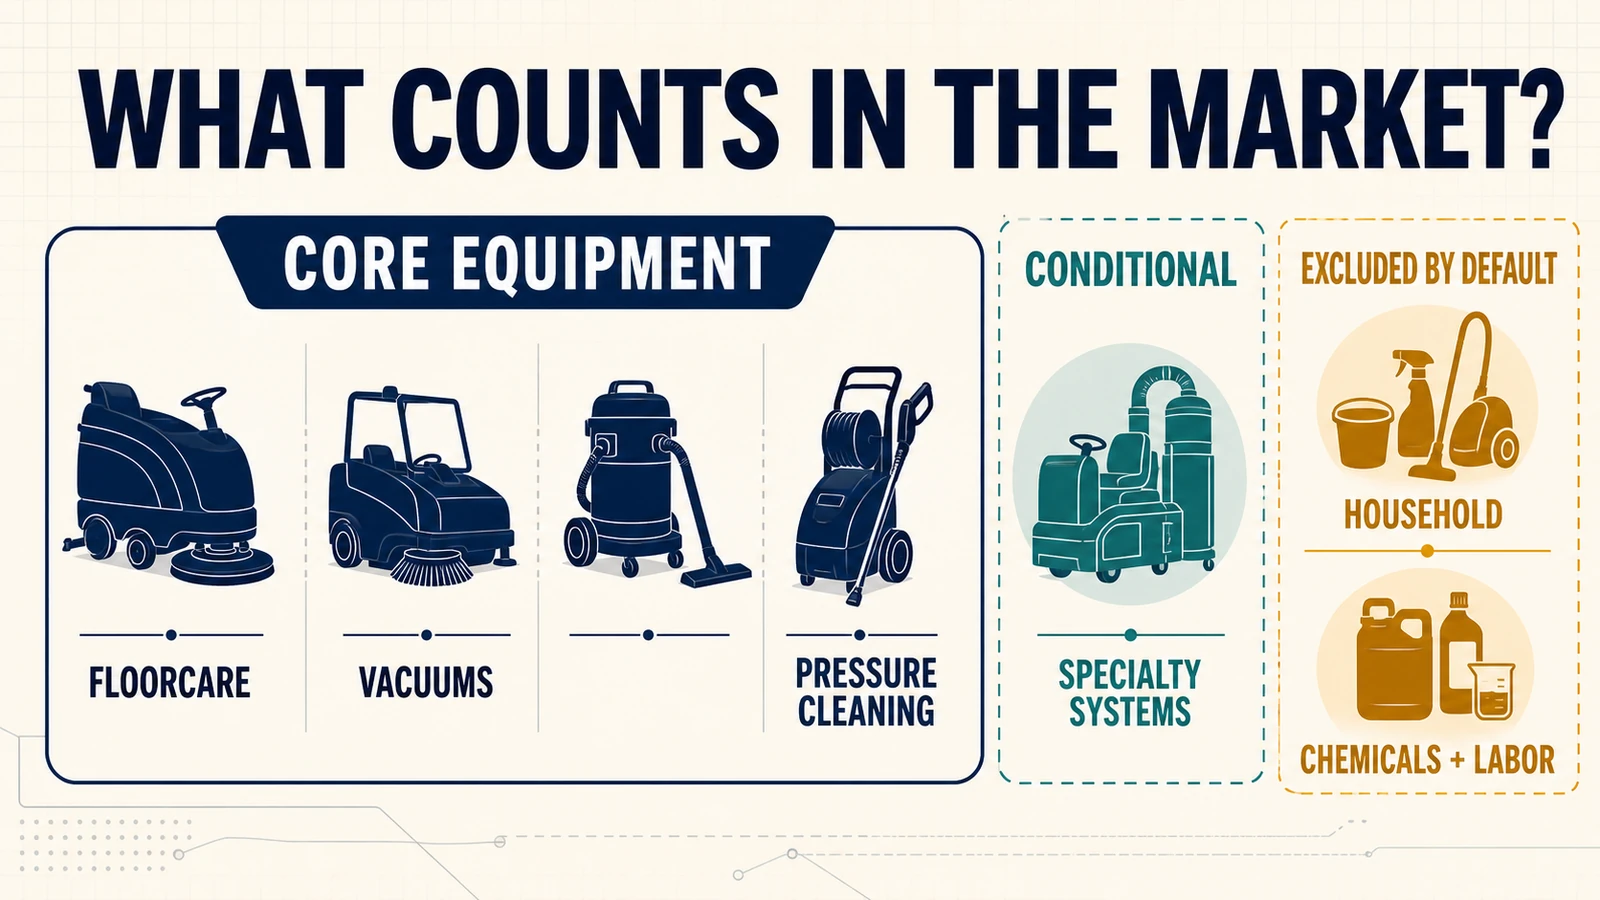
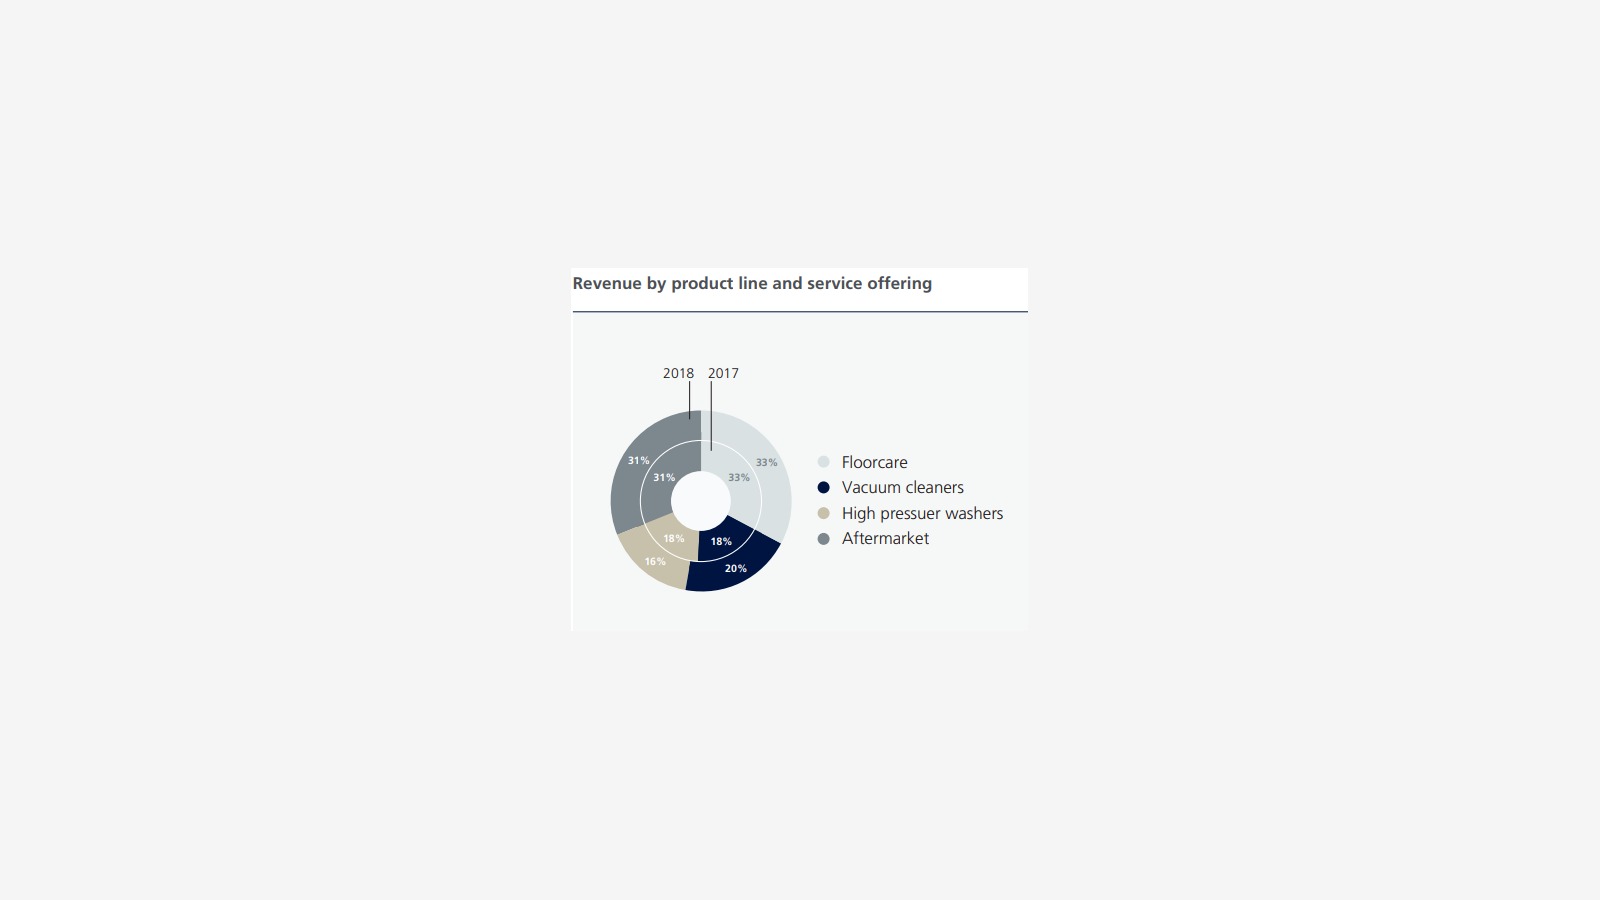
Sales by Product:
Floor Care: €347.6 million, approximately 33%
Vacuum Cleaners: €207.6 million, approximately 20%
High-Pressure Washers: €167.6 million, approximately 16%
Aftermarket: €331.5 million, approximately 31%
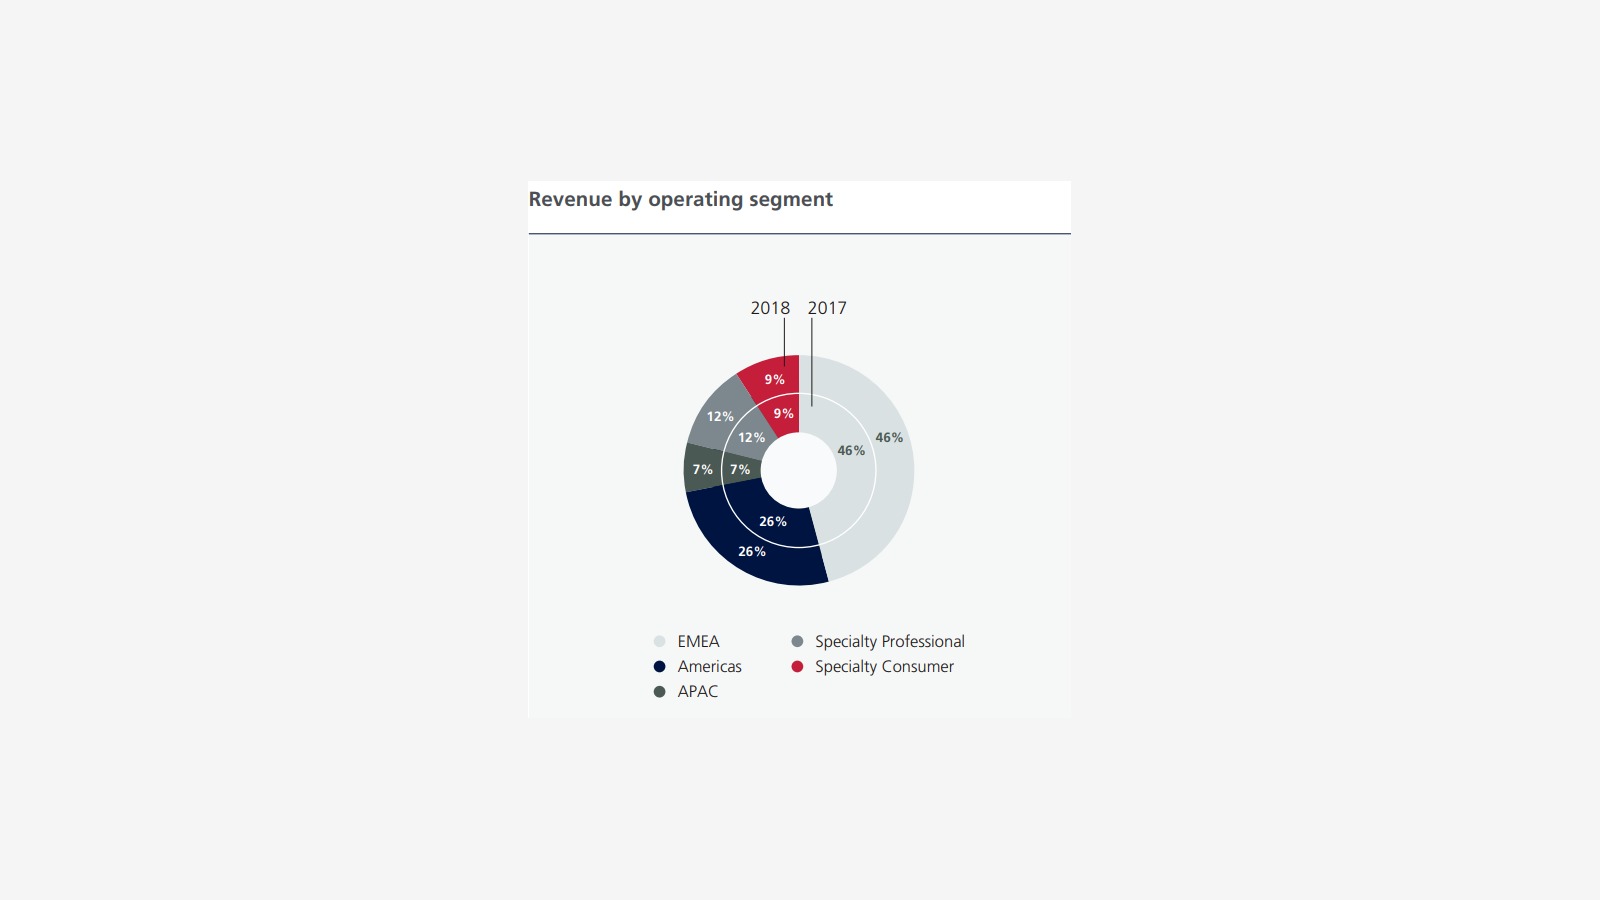
Sales breakdown by region:
EMEA 46%, North America 26%, APAC 7%, professional products 12%, consumer products 9%.
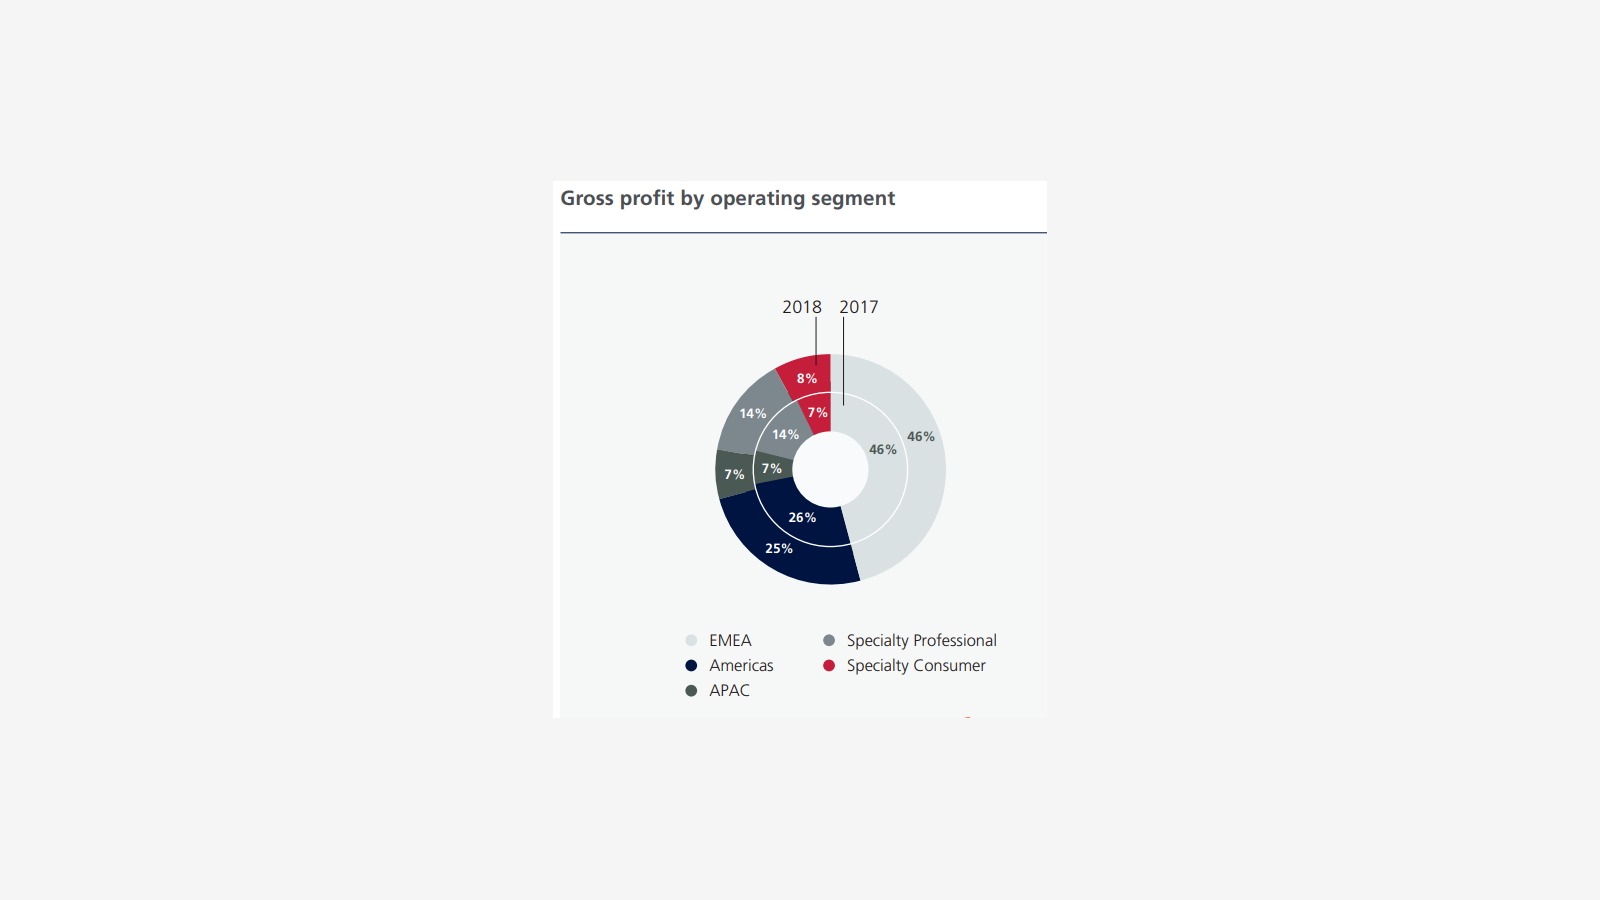
Gross margin by region:
EMEA 46%, North America 25%, APAC 7%, professional products 14%, consumer products 8%.
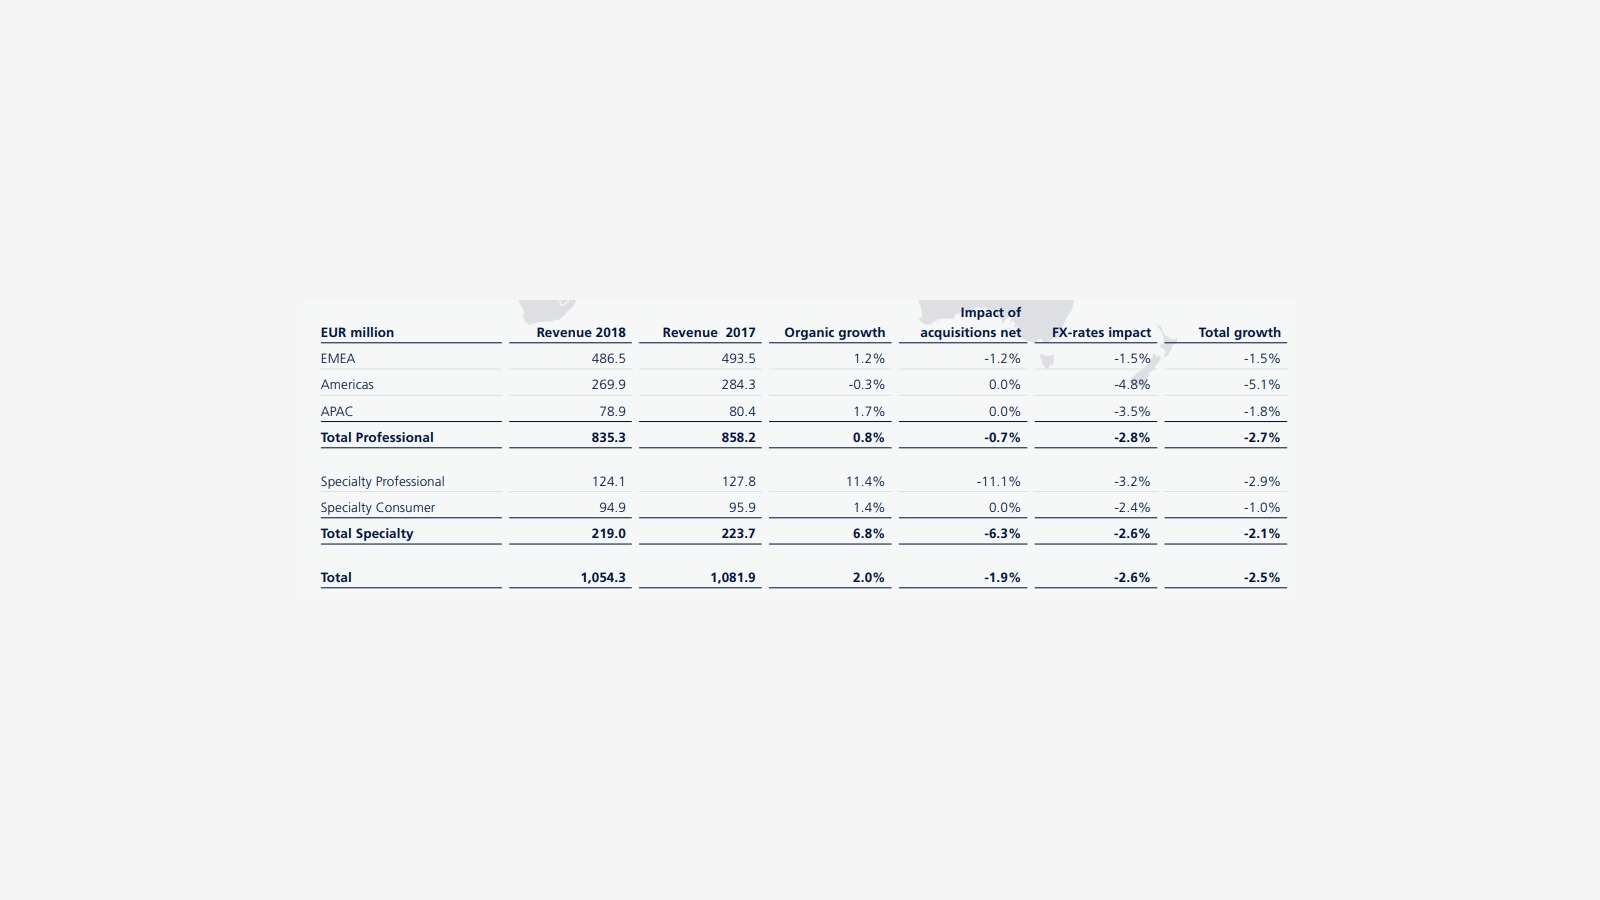
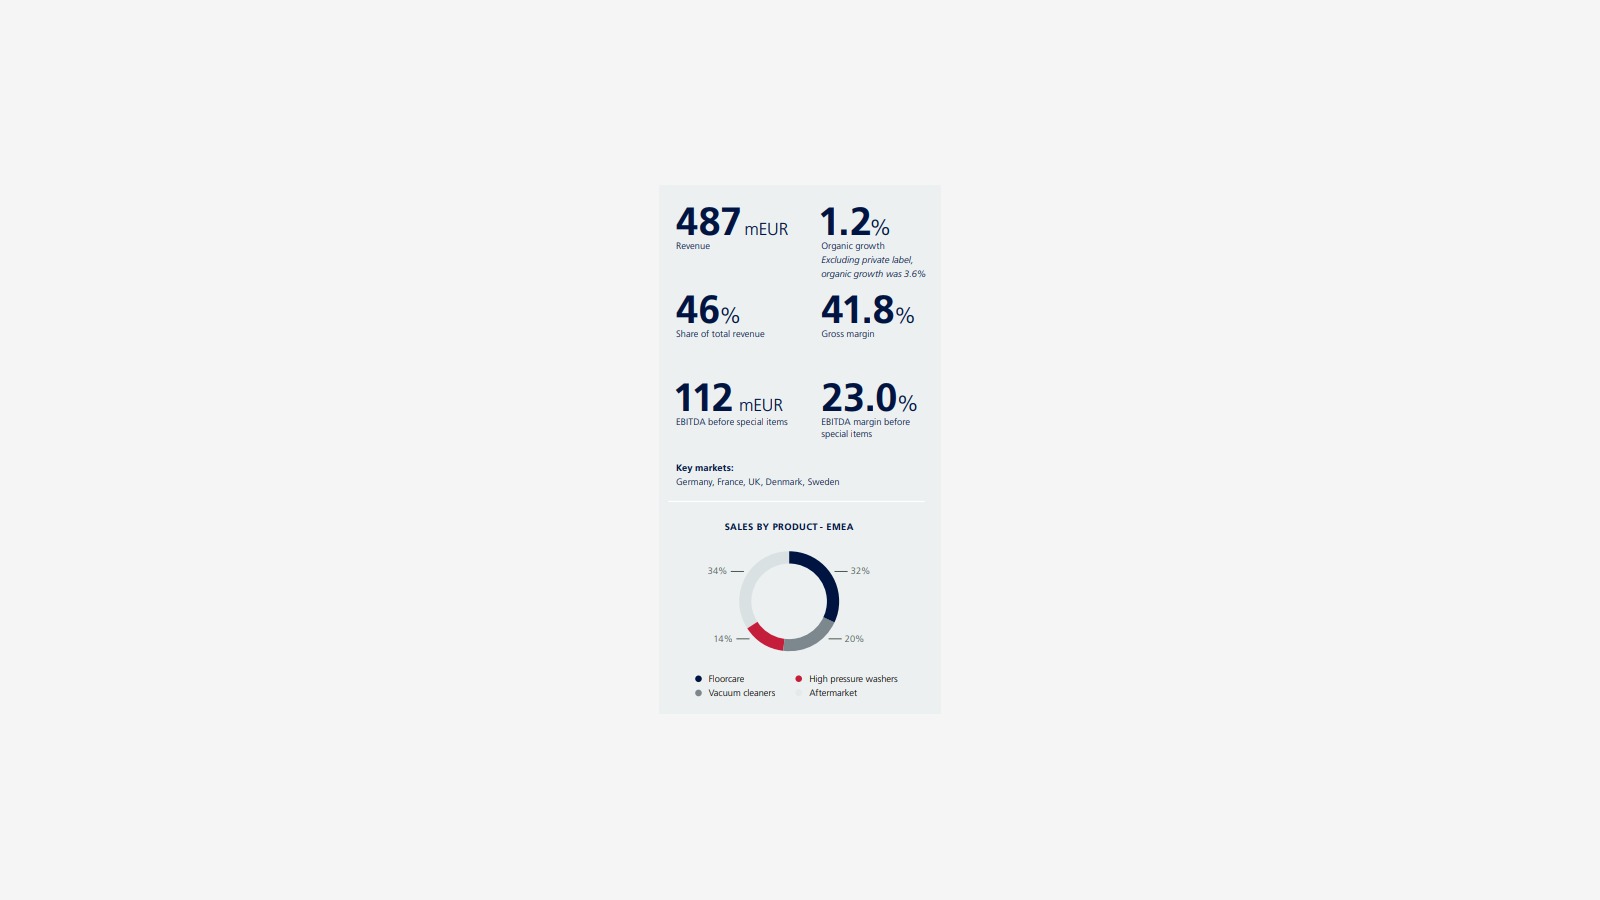
EMEA sales amounted to 487 million euros, with a natural growth rate of 1.2%, accounting for 46% of total sales. The gross margin was 41.8%. Core markets include Germany, France, UK, Denmark, and Sweden. In terms of product sales in the EMEA region, Floorcare accounted for 32%, vacuum cleaners for 32%, pressure washers for 14%, and after-sales services for 20%.
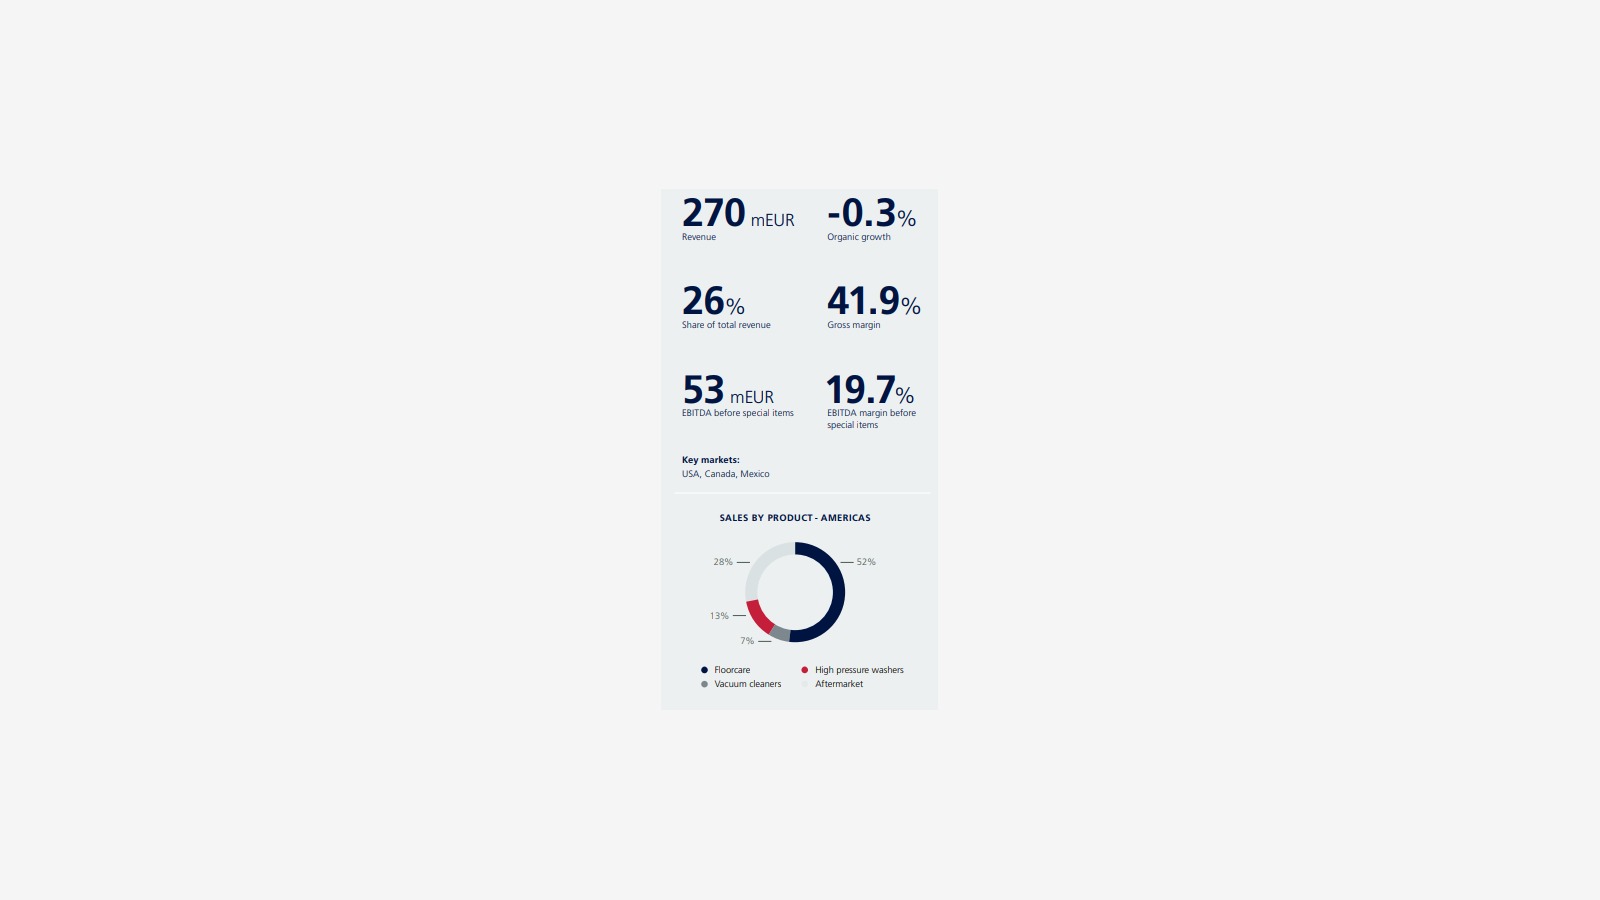
North American regional sales amounted to 270 million euros, with a natural growth rate of -0.3%, accounting for 26% of total sales. The gross margin was 41.9%. Core markets included the United States, Canada, and Mexico. Product sales in the North American region were distributed as follows: Floorcare accounted for 52%, vacuum cleaners for 7%, pressure washers for 13%, and after-sales market for 28%.
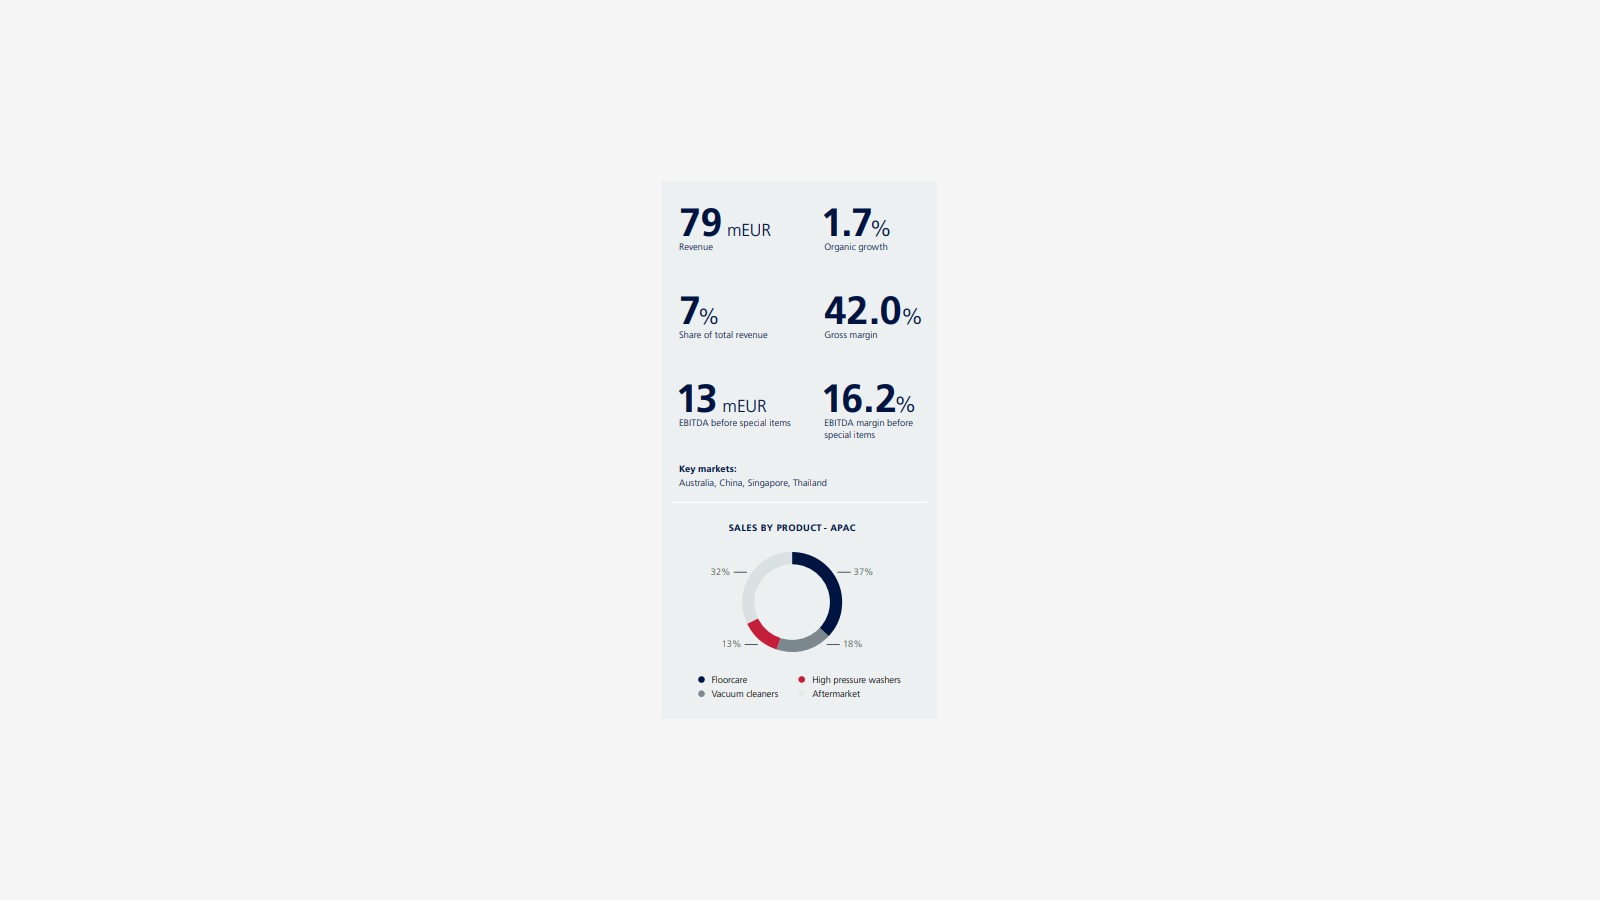
APAC region sales amounted to 79 million euros, with a natural growth rate of 1.7%, accounting for 7% of total sales. The gross margin was 42%. Core markets: Australia, China, Singapore, Thailand. Product sales in the APAC region by category were as follows: Floorcare accounted for 37%, vacuum cleaners for 18%, pressure washers for 13%, and after-sales market for 32%.
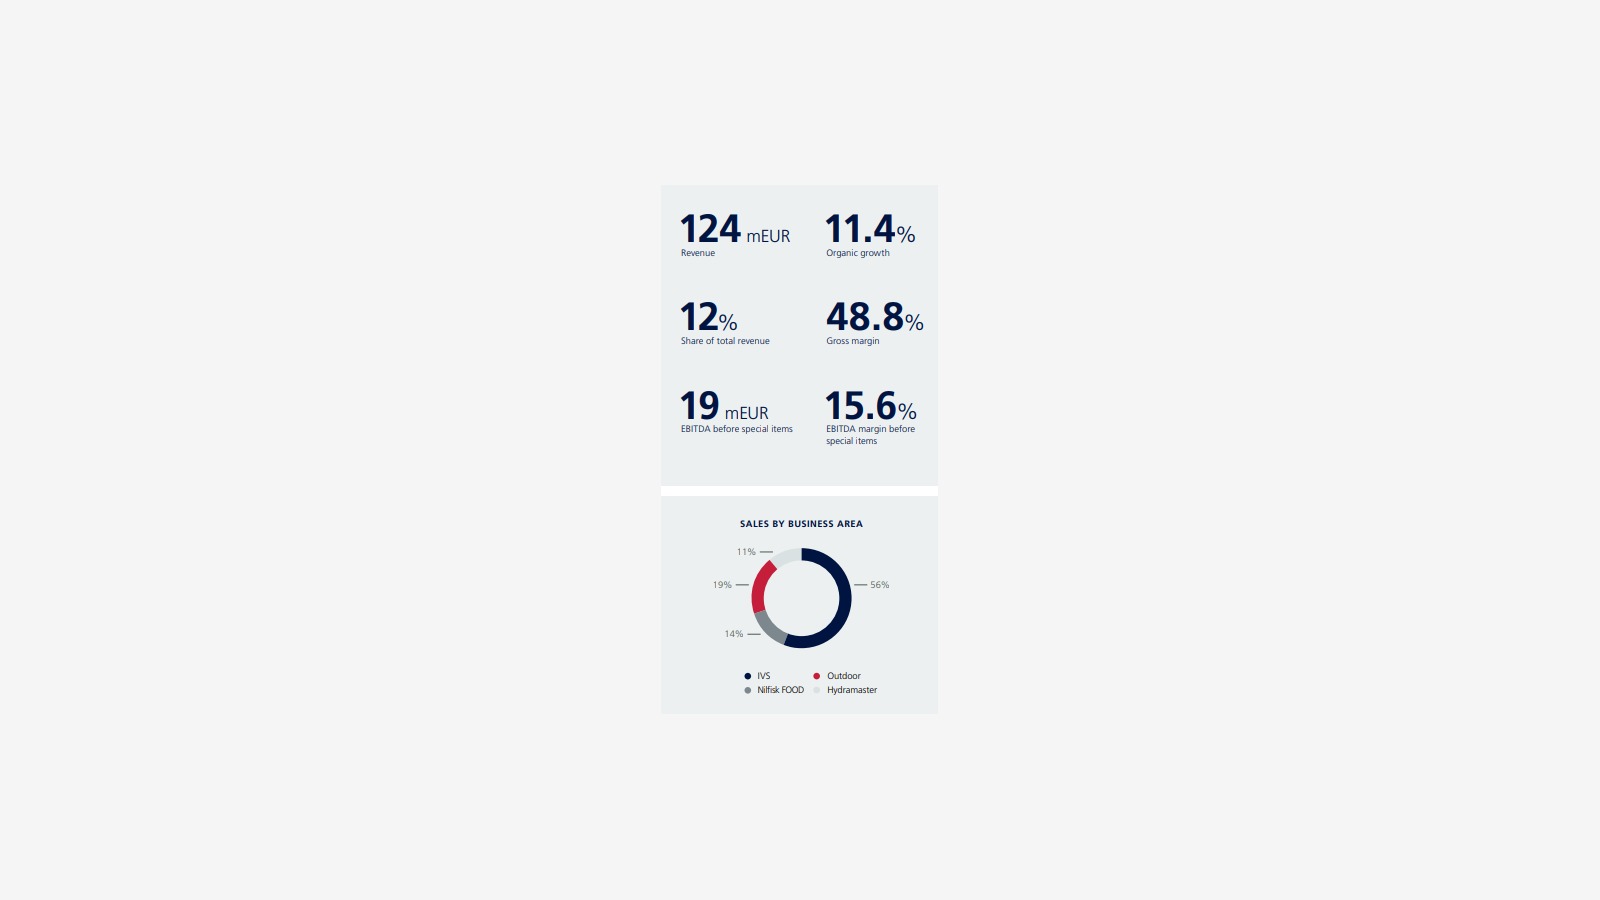
Professional-grade product sales amounted to 124 million euros, with a natural growth rate of 11.4%, accounting for 12% of total sales. The gross margin was 48.8%. Product sales breakdown: IVS 56%, Nilfisk food 14%, high-pressure washers 19%, and Hydramaster 11%.
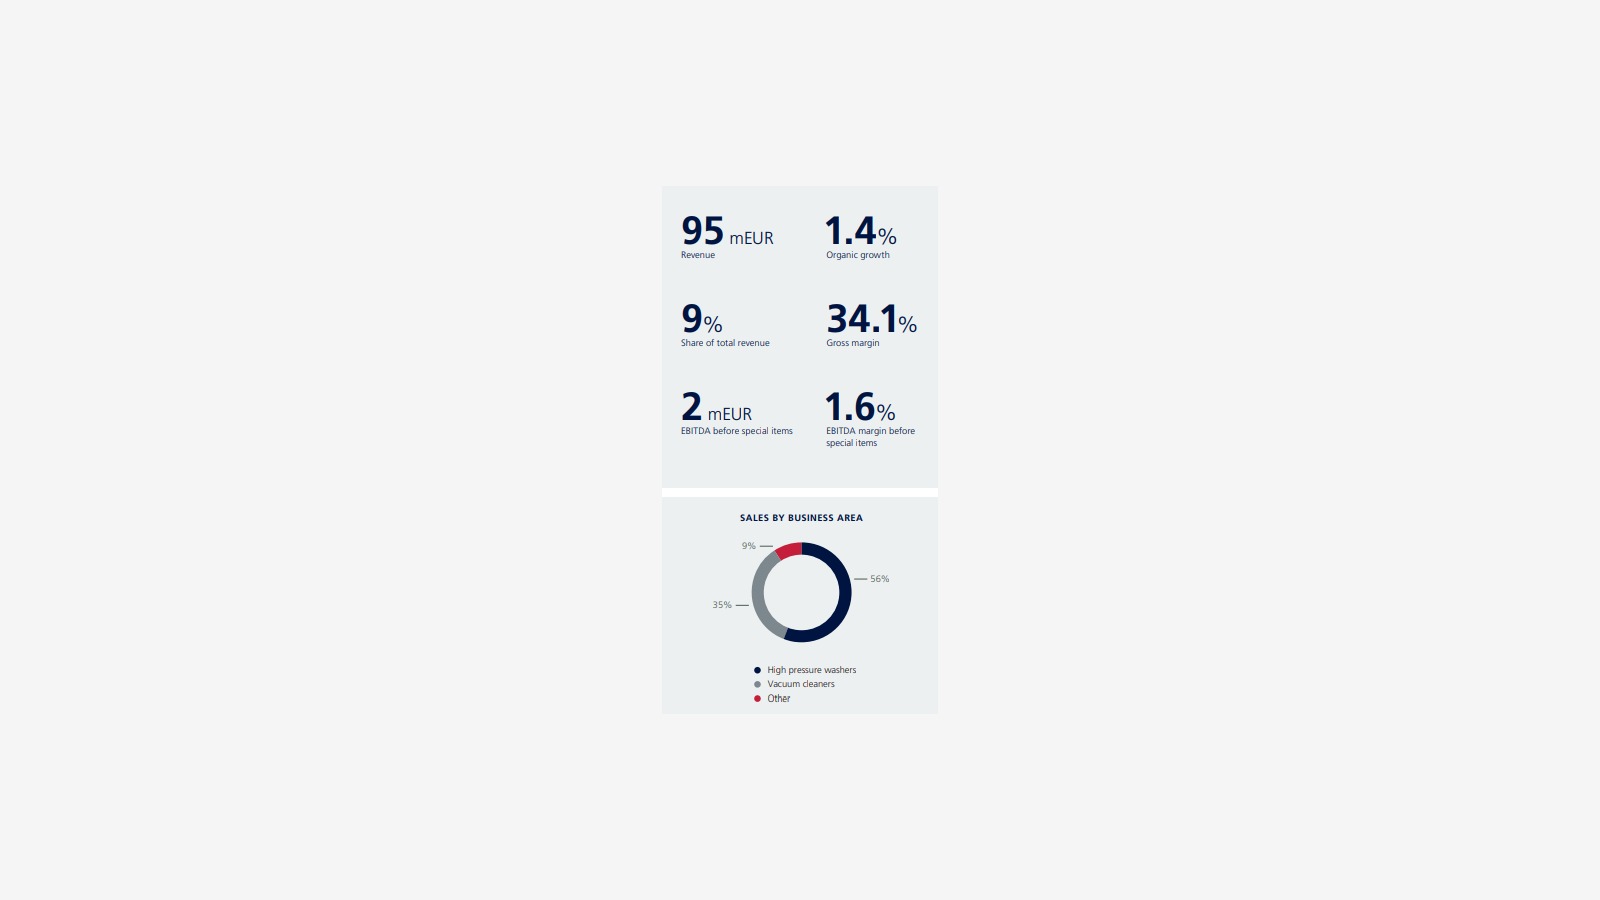
Sales of consumer-grade products amounted to 95 million euros, with a natural growth rate of 1.4%, accounting for 9% of total sales. The gross margin was 34.1%. Sales breakdown by product category: pressure washers at 56%, vacuum cleaners at 35%, and other at 9%.
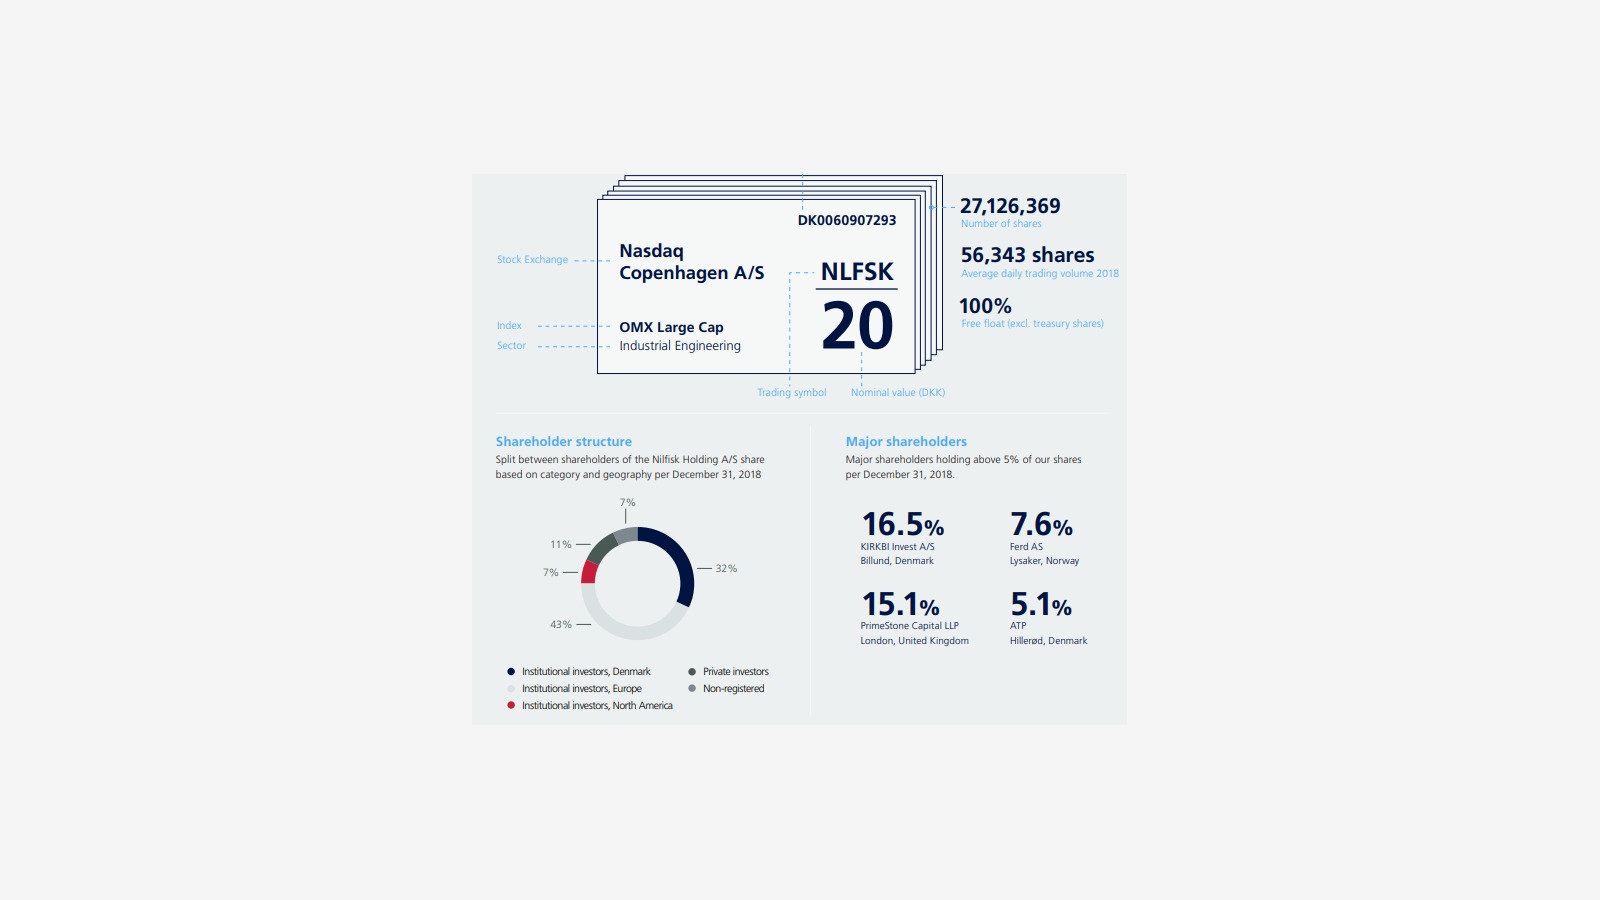
Shareholder Structure:
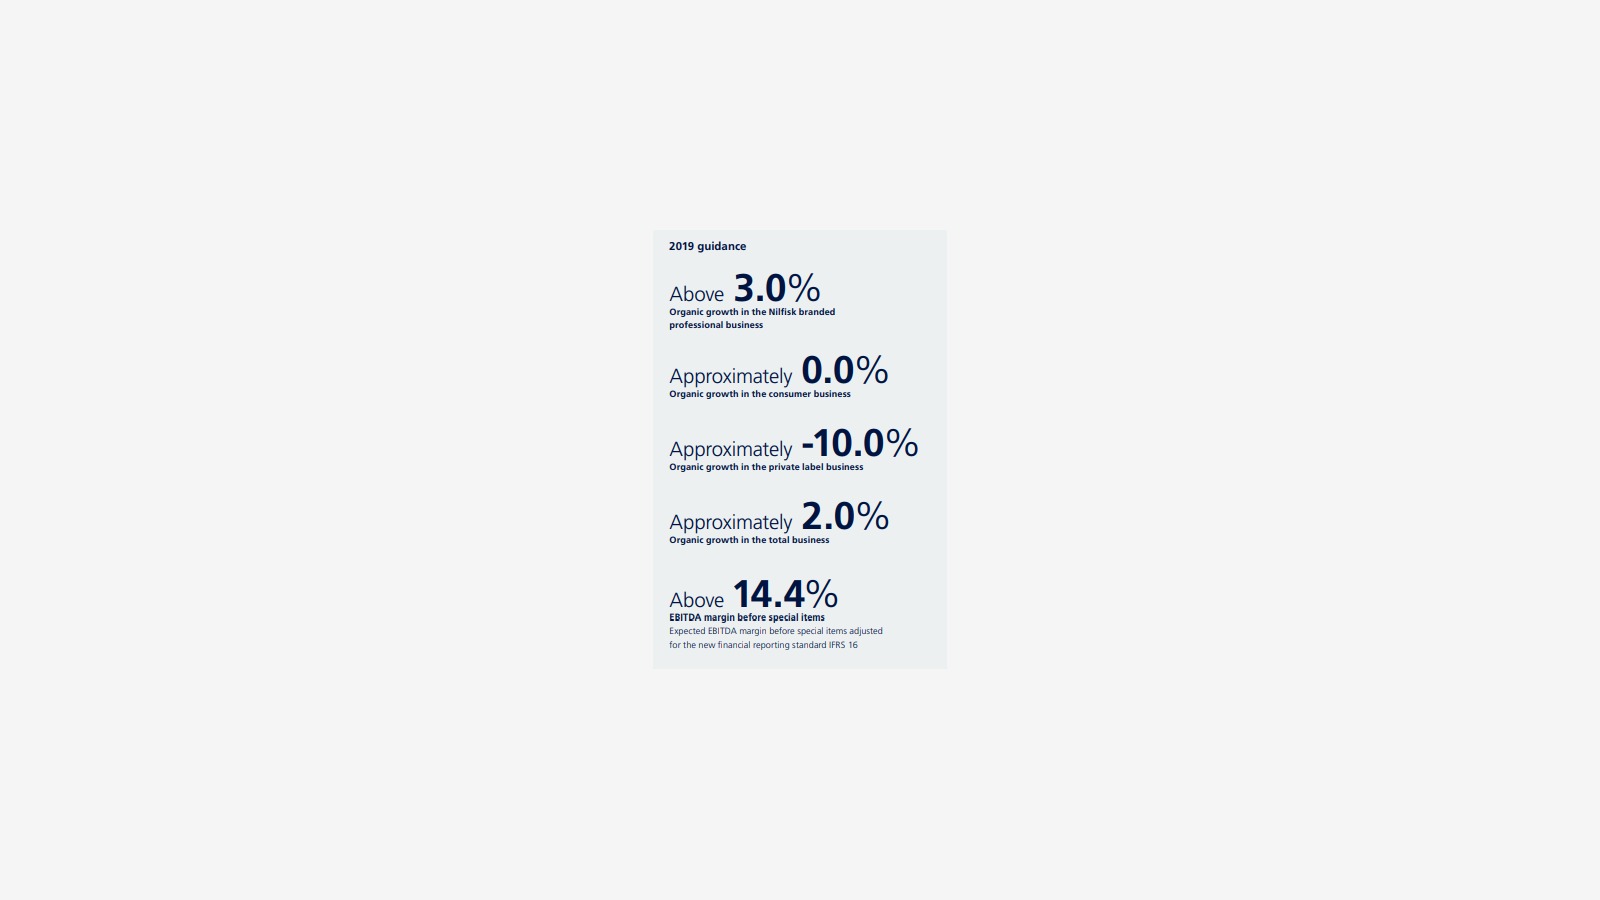
Target for 2019:
Professional-grade products under the Nilfisk brand experienced natural growth of 3%, consumer-grade products saw no natural growth, private label products showed a natural decline of 10%, resulting in overall business growth of 2%, with EBITA increasing by 14.4%.
Buyers evaluating automation can compare the six commercial cleaning robot opportunities by facility use case, deployment evidence, and service economics.