- A market-size figure is not comparable until the year, product scope, geography and value layer are aligned.
- Two 2026 HKEX draft applications provide useful public benchmarks: US$2.243 billion in 2024 retail value under one scope and US$2.7997 billion in 2025 GMV under another.
- Shipments, value, adoption and cordless mix describe different parts of the industry and should be kept as separate data series.
In this article 12 sections
How large is the robotic pool cleaner market? Two recent public benchmarks put it at US$2.243 billion in 2024 retail value and US$2.7997 billion in 2025 gross merchandise value, or GMV. Those figures come from different commissioned research series disclosed in separate 2026 Hong Kong listing applications. They are useful, but they are not one interchangeable answer.
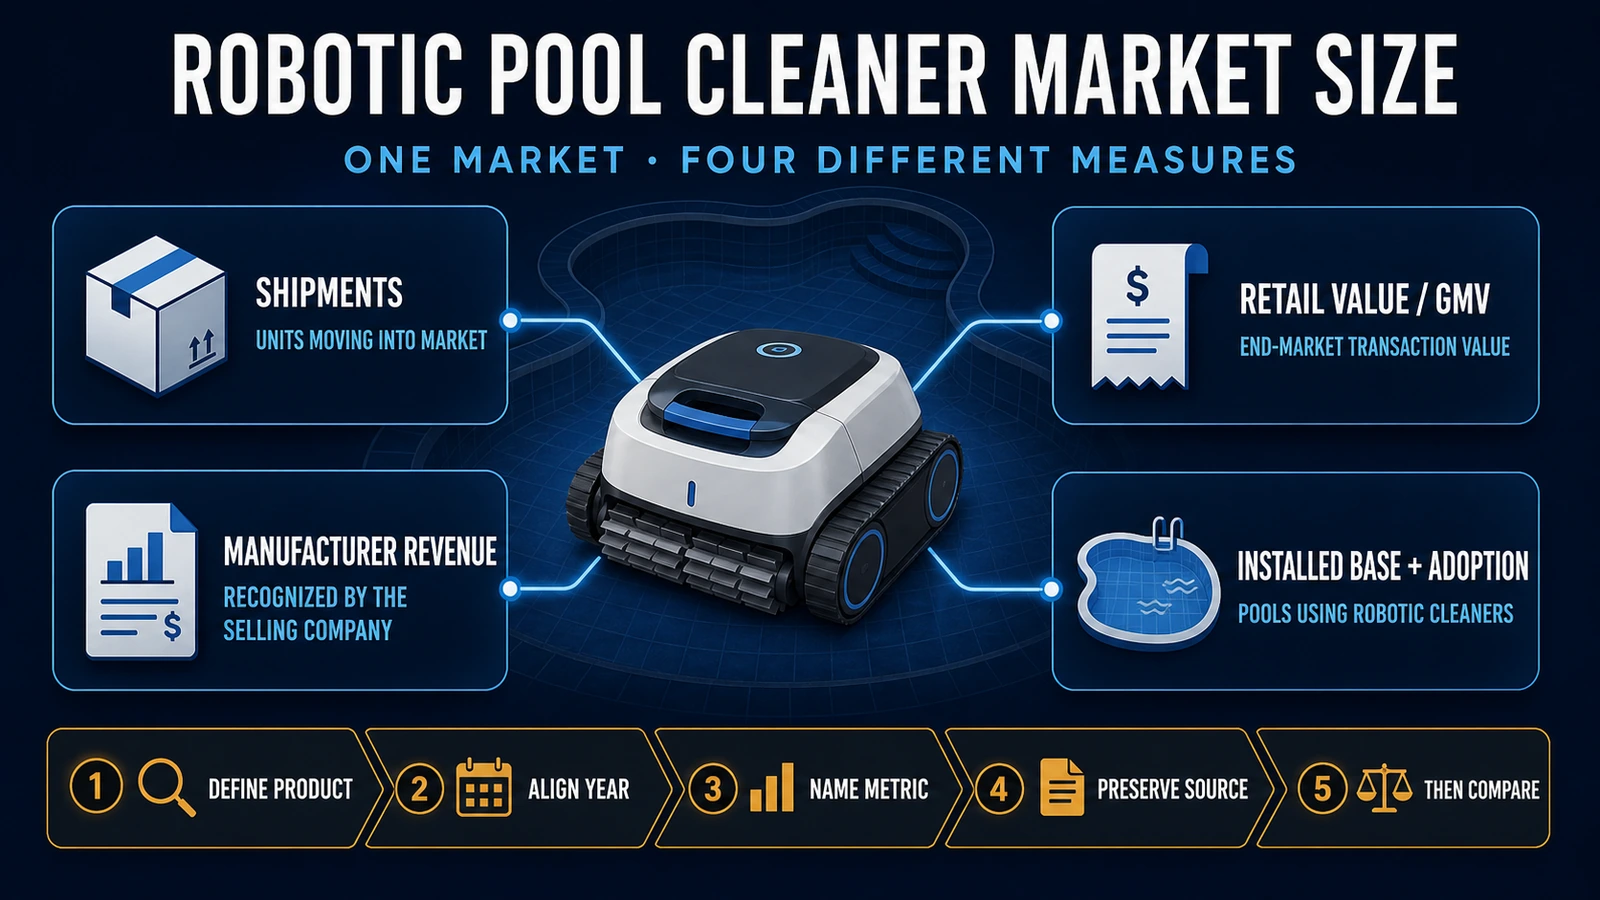
The defensible answer must preserve the year, metric, product definition and source. A shipment estimate measures units. Retail value or GMV measures end-market transactions. Manufacturer revenue measures what a company recognizes after its own channel and accounting effects. Installed pools and robotic-cleaner adoption describe the addressable base, not annual sales.
This distinction matters to manufacturers, distributors, importers, investors and market researchers. If incompatible figures are averaged into one apparently precise number, the result becomes less reliable—not more.
Robotic Pool Cleaner Market Size at a Glance
| Public data series | Base-year market | Forecast | What it measures | Source boundary |
|---|---|---|---|---|
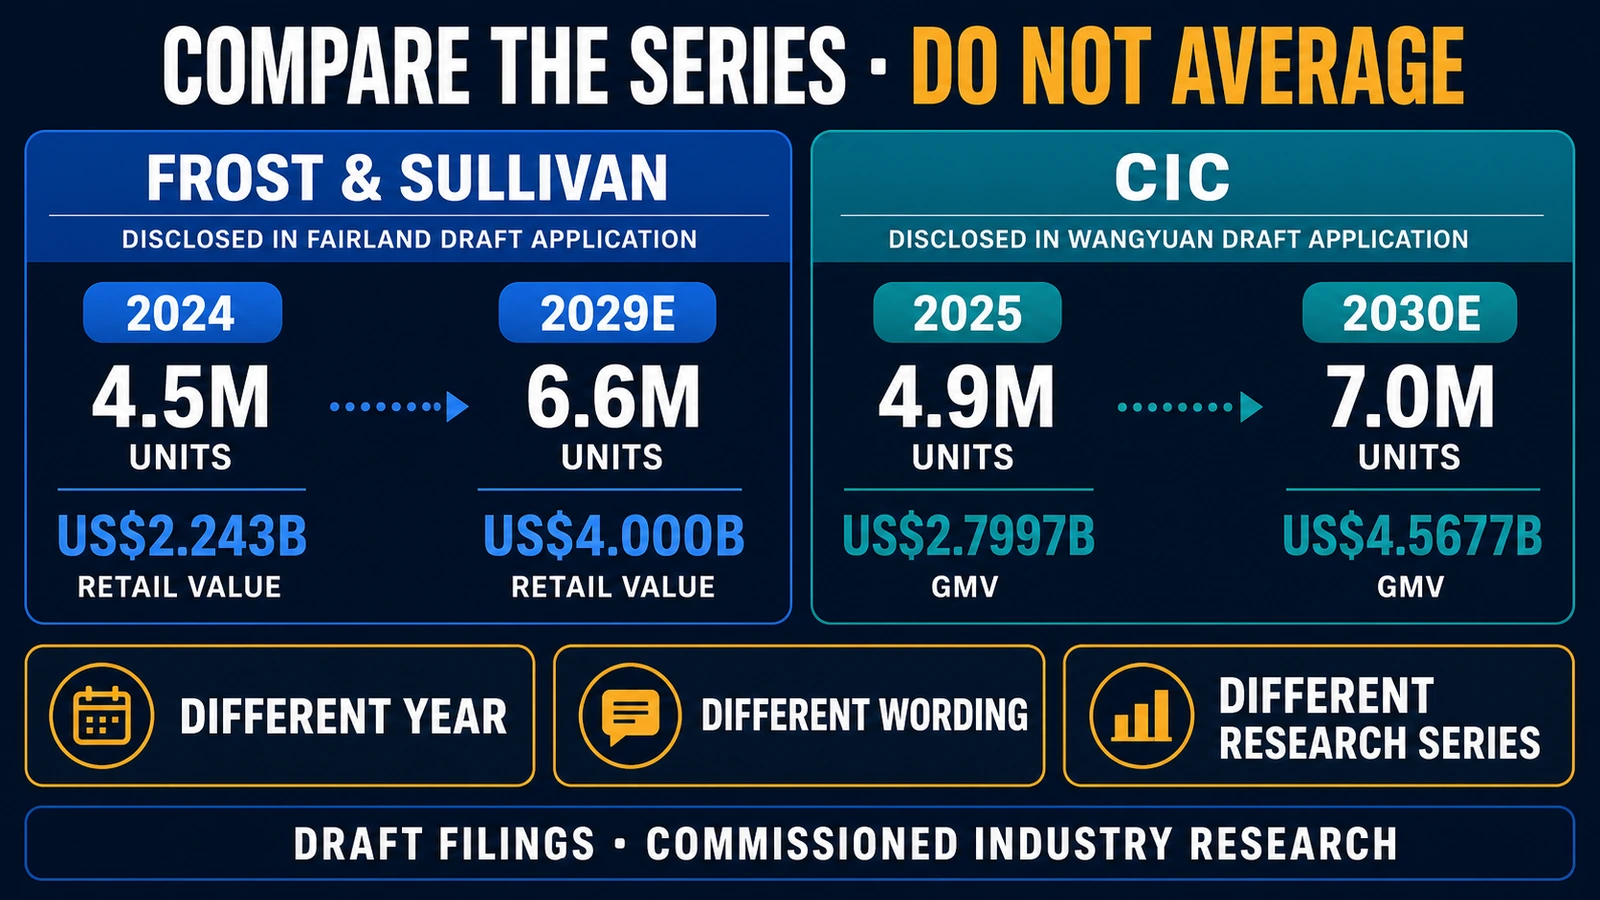
| Frost & Sullivan in Fairland draft application | 2024: 4.5 million units; US$2.243 billion | 2029E: 6.6 million units; US$4.000 billion | Shipments and retail market value for “intelligent pool cleaning robots” | Commissioned industry research disclosed in a 2026 draft listing document |
| CIC in Wangyuan draft application | 2025: 4.9 million units; US$2.7997 billion | 2030E: 7.0 million units; US$4.5677 billion | Shipments and GMV for “robotic pool cleaners” | Commissioned industry research disclosed in a 2026 draft listing document |
Both series indicate a growing category, a large US and European base, and faster value growth than unit growth. They should still be cited separately. Their base years differ, their labels differ, and neither filing presents the figures as a government census or an audited global market account.
Why Is There No Single Robotic Pool Cleaner Market-Size Number?
The term `market size` can answer several different questions.
Shipment volume
Shipments count machines moving into a defined market or channel during a period. The count may represent manufacturer sell-in rather than final consumer sell-through. Inventory built at distributors or retailers can therefore separate shipments from end demand.
Shipment data are useful for factories, component suppliers, logistics providers and capacity planning. They do not disclose the value retained by the manufacturer or the price paid by the final customer.
Retail value or GMV
Retail value attempts to measure end-market sales. GMV usually represents the gross value of merchandise transacted through the defined channels before some deductions. The exact treatment of discounts, returns, tax, shipping and marketplace fees depends on the research methodology.
The Wangyuan draft application uses GMV in its narrative. The surrounding industry presentation also uses retail-value language. A careful analyst should preserve the document’s terminology and request the underlying methodology before treating the number as net sales.
Manufacturer or brand revenue
A company may sell to a distributor below the final retail price, operate a direct-to-consumer store, receive licensing income, consolidate subsidiaries or recognize revenue in different countries. Its reported revenue is therefore not the same as global retail value.
Adding the revenue of a few listed companies will also miss private brands, OEM suppliers and channel margins—and can double-count sales between companies.
Installed pool base and adoption
The number of pools describes the addressable maintenance base. Adoption describes the share of pools that use a robotic cleaner under the research definition. Neither equals annual unit demand.
One pool may keep a robot for several years, replace it, own more than one unit or use a professional service provider’s equipment. Annual sales combine first adoption, replacement, multiple-unit ownership and channel inventory.
What Do the Two Public Filing Series Actually Say?
Frost & Sullivan series in the Fairland application
The Fairland draft application, published through HKEX in April 2026, cites Frost & Sullivan for the following global `intelligent pool cleaning robot` data:
- shipments of 4.5 million units in 2024, forecast to reach 6.6 million in 2029;
- retail market value of US$2.243 billion in 2024, forecast to reach US$4.000 billion in 2029;
- the United States at 46.3% and Europe at 33.0% of 2024 shipments; and
- cordless shipments of 2.0 million units in 2024, or 44.5% of the total, forecast to reach 4.4 million in 2029.
The disclosed compound annual growth rates are 8.0% for total shipments, 12.3% for retail value and 17.1% for cordless shipments from 2024 to 2029.
CIC series in the Wangyuan application
The Wangyuan draft application, also published through HKEX in April 2026, cites CIC for a separate global `robotic pool cleaner` series:
- shipments of 4.9 million units in 2025, forecast to reach 7.0 million in 2030;
- GMV of US$2.7997 billion in 2025, forecast to reach US$4.5677 billion in 2030;
- the United States at about 45.2% and Europe at about 34.3% of 2025 shipments;
- global adoption of 27.8% in 2025, forecast to reach 34.7% in 2030; and
- cordless shipments of 2.5 million in 2025, or 51.5% of the total, forecast to reach 5.0 million in 2030.
The same series places corded shipments at 2.4 million units in 2025 and 2.0 million in 2030. It therefore describes not only category growth, but a material shift in product architecture.
Should the Two Market Estimates Be Averaged?
No. Averaging them would erase information that the reader needs.
| Alignment question | Fairland / Frost & Sullivan | Wangyuan / CIC |
|---|---|---|
| Base year | 2024 | 2025 |
| Forecast year | 2029 | 2030 |
| Product wording | Intelligent pool cleaning robots | Robotic pool cleaners |
| Value wording | Retail market value | GMV, with retail-value language nearby |
| Research provider | Frost & Sullivan | CIC |
| Commissioning context | Fairland listing application | Wangyuan listing application |
The figures are close enough to reinforce the broad direction, but not identical enough to merge. The proper citation is a complete sentence such as: “Frost & Sullivan estimated 2024 retail market value at US$2.243 billion in Fairland’s 2026 draft application.”
That wording lets another analyst find the original document, identify the year and preserve the value layer.
What Can Be Learned From Units and Value Together?
Within each research series, market value grows faster than shipments.
In the Frost & Sullivan series, shipments increase at an 8.0% CAGR while retail value increases at 12.3% from 2024 to 2029. In the CIC series, shipments increase at 7.6% while GMV increases at 10.3% from 2025 to 2030.
That relationship is consistent with a rising average value per shipped unit within each model. Simple division produces approximately US$498 per unit in the 2024 Frost & Sullivan series and approximately US$571 per unit in the 2025 CIC series. These are derived ratios, not quoted universal selling prices.
Several mechanisms could contribute:
- customers moving toward wall, waterline, navigation, connectivity or multi-function features;
- cordless and premium products changing the mix;
- channel and geographic mix changing;
- inflation, tariffs, freight or currency affecting retail prices; and
- the research methodology capturing value differently across channels.
The calculation does not prove that every product is becoming more expensive or that manufacturer margins are increasing. Higher retail value can coexist with brand discounting, distributor margin pressure or higher customer-acquisition cost.
Is Cordless the Main Growth Segment?
The public filing data strongly support a cordless mix shift.
Frost & Sullivan puts cordless units at 44.5% of 2024 shipments and forecasts 4.4 million cordless units in 2029. CIC puts the cordless share at 51.5% in 2025 and forecasts 5.0 million cordless units in 2030, while corded shipments decline.
For a manufacturer, this changes battery sourcing, battery-management systems, sealing, charging, transport and end-of-life responsibilities. For a distributor, it changes inventory, service parts and returns. For a buyer, it changes charging workflow, runtime, retrieval and lifecycle cost.
It does not establish that cordless is universally better. Corded and cordless cleaners are different operating systems with different failure modes and use cases. The Cordless vs Corded Robotic Pool Cleaner guide addresses those procurement differences separately.
Which Regions Drive the Market?
Both filing series place roughly four-fifths of global shipments in the United States and Europe.
That concentration has practical B2B consequences:
- brands need local distribution, returns, repairs and seasonal inventory planning in the two core regions;
- battery, electrical, radio, environmental and consumer-product obligations depend on destination market;
- professional pool channels remain important even as Amazon, direct-to-consumer and mass retail expand; and
- a global shipment estimate does not tell a supplier which price bands, pool types or sales channels are growing.
The Wangyuan/CIC series also estimates 34.1 million pools worldwide in 2025 and a global robotic-cleaner adoption rate of 27.8%. The metric is defined as pools adopting robotic cleaners divided by total pools. It forecasts adoption of 34.7% in 2030.
Those figures suggest room for first-time adoption, but the installed base must not be converted directly into annual sales. A demand model also needs replacement cycles, active versus inactive pools, product life, multiple-unit ownership, commercial fleets and channel inventory.
Maytronics publishes a different company estimate of approximately 28.5 million pools on its company profile. Importantly, the page says its pool-count and market-share figures are internal estimates and are not official or precise information. That disclosure is exactly why analysts should record provenance rather than selecting whichever installed-base number produces the largest opportunity.
Why Do Commercial Market Reports Show Much Larger or Smaller Numbers?
Public report pages can differ by several multiples while using similar titles. The first diagnostic should be methodology, not CAGR.
Ask whether the report includes:
- only self-propelled electric robots, or also suction and pressure-side cleaners;
- residential products, commercial products or both;
- robotic cleaners alone, or a wider pool-cleaning equipment category;
- manufacturer sell-in, distributor sales, retail sell-through or marketplace GMV;
- tax, freight, discounts and returns;
- corded, cordless and solar products under the same definition;
- only active pools or all installed pools;
- historical observations, modelled estimates or forecasts; and
- a transparent list of sources and currency assumptions.
A report can be internally consistent and still be unsuitable for comparison with another report. A larger figure may reflect a broader category or a later value layer. A smaller figure may reflect manufacturer revenue, a restricted geography or a narrower product definition.
Category Growth Does Not Mean Every Supplier Is Growing
Market forecasts describe an aggregate model. Company results describe the performance of one business with a particular product mix, geography, channel and cost structure.
Maytronics, the company behind Dolphin, reported pressure in its residential robotic pool-cleaner business during 2025. Its disclosures discuss competition, pricing, inventory, tariffs and operational execution. Its FY2025 investor presentation says management would prioritize robotic pool cleaning while improving operations and reducing portfolio dispersion in 2026.
That is not evidence against long-term category growth. It is evidence that market growth, market share, channel execution and profitability are four different questions.
The same separation matters when assessing emerging suppliers. A brand can grow unit share through low prices while retaining a smaller share of GMV. An OEM can produce large volumes without owning the consumer brand or receiving the retail margin. A distributor can control access to customers without manufacturing the robot.
How Should a B2B Team Audit a Market-Size Claim?
Use a repeatable evidence record.
| Field | What to record |
|---|---|
| Source | Original filing, annual report, customs dataset or full methodology—not a copied summary |
| Publisher and commissioner | Who conducted the research and who paid for or disclosed it |
| Publication date | When the estimate was produced or released |
| Data year | Historical, current estimate or forecast |
| Product definition | Included technologies, pool types and exclusions |
| Metric | Shipments, sell-in, sell-through, GMV, retail value or recognized revenue |
| Geography | Destination market, reporting entity or global total |
| Channel | Professional, distribution, mass retail, marketplace or DTC |
| Segments | Residential/commercial and corded/cordless treatment |
| Currency treatment | Exchange rate, tax, freight and inflation assumptions |
| Cross-check | Units × implied value, company revenue, customs data, pool base or adoption |
For procurement, the market-size number is only the beginning. A sourcing team should also examine legal manufacturer identity, factory capability, destination-market importer, product certification, battery compliance, warranty entity, parts supply, recall process and patent exposure. The Robotic Pool Cleaner Manufacturers in China guide explains how to separate brand, manufacturer and OEM roles.
FAQ
What is the global robotic pool cleaner market size?
Useful public benchmarks include US$2.243 billion in 2024 retail value under the Frost & Sullivan scope disclosed by Fairland and US$2.7997 billion in 2025 GMV under the CIC scope disclosed by Wangyuan. Always cite the year, metric and source because the figures are not directly interchangeable.
How many robotic pool cleaners are sold each year?
The two 2026 HKEX draft applications cite 4.5 million global shipments for 2024 under one research scope and 4.9 million for 2025 under another. Shipments are not necessarily final consumer sell-through.
How fast is the robotic pool cleaner industry growing?
The cited series forecast total shipment CAGRs of about 8% and value CAGRs above 10% over their respective five-year periods. These are forecasts from commissioned industry research, not guaranteed outcomes.
What share of the market is cordless?
Frost & Sullivan estimated cordless at 44.5% of 2024 shipments. CIC estimated 51.5% for 2025. The estimates use different series, but both show a rapid cordless mix shift.
Is market share based on units or revenue?
It can be either. Unit share rewards volume; GMV, retail-value or revenue share reflects value at a specified transaction layer. A company can rank differently under each measure.
Does a growing pool base equal annual robot demand?
No. Annual demand also depends on adoption, replacement cycles, product life, active pools, multiple-unit ownership, commercial use and channel inventory.
Which market report should a buyer trust?
Prefer the report that discloses its product definition, data year, geography, value layer, source base and methodology. Use multiple compatible checks, but do not average incompatible estimates.
Final Takeaway
The robotic pool cleaner market is large and still growing, but the most professional answer is not a naked dollar figure. It is a traceable data statement.
For current public benchmarking, the Fairland/Frost & Sullivan series provides 2024 shipments and retail value, while the Wangyuan/CIC series provides 2025 shipments, GMV and adoption. Keep them separate, label forecasts, and use company results only as operating cross-checks.
For World Clean Biz readers, the rule is simple:
Define the product. Align the year. Name the metric. Preserve the source. Then compare.