- IFR reported more than 25,000 professional cleaning robots sold in 2024, but its supplier-sample data was not projected to the whole industry.
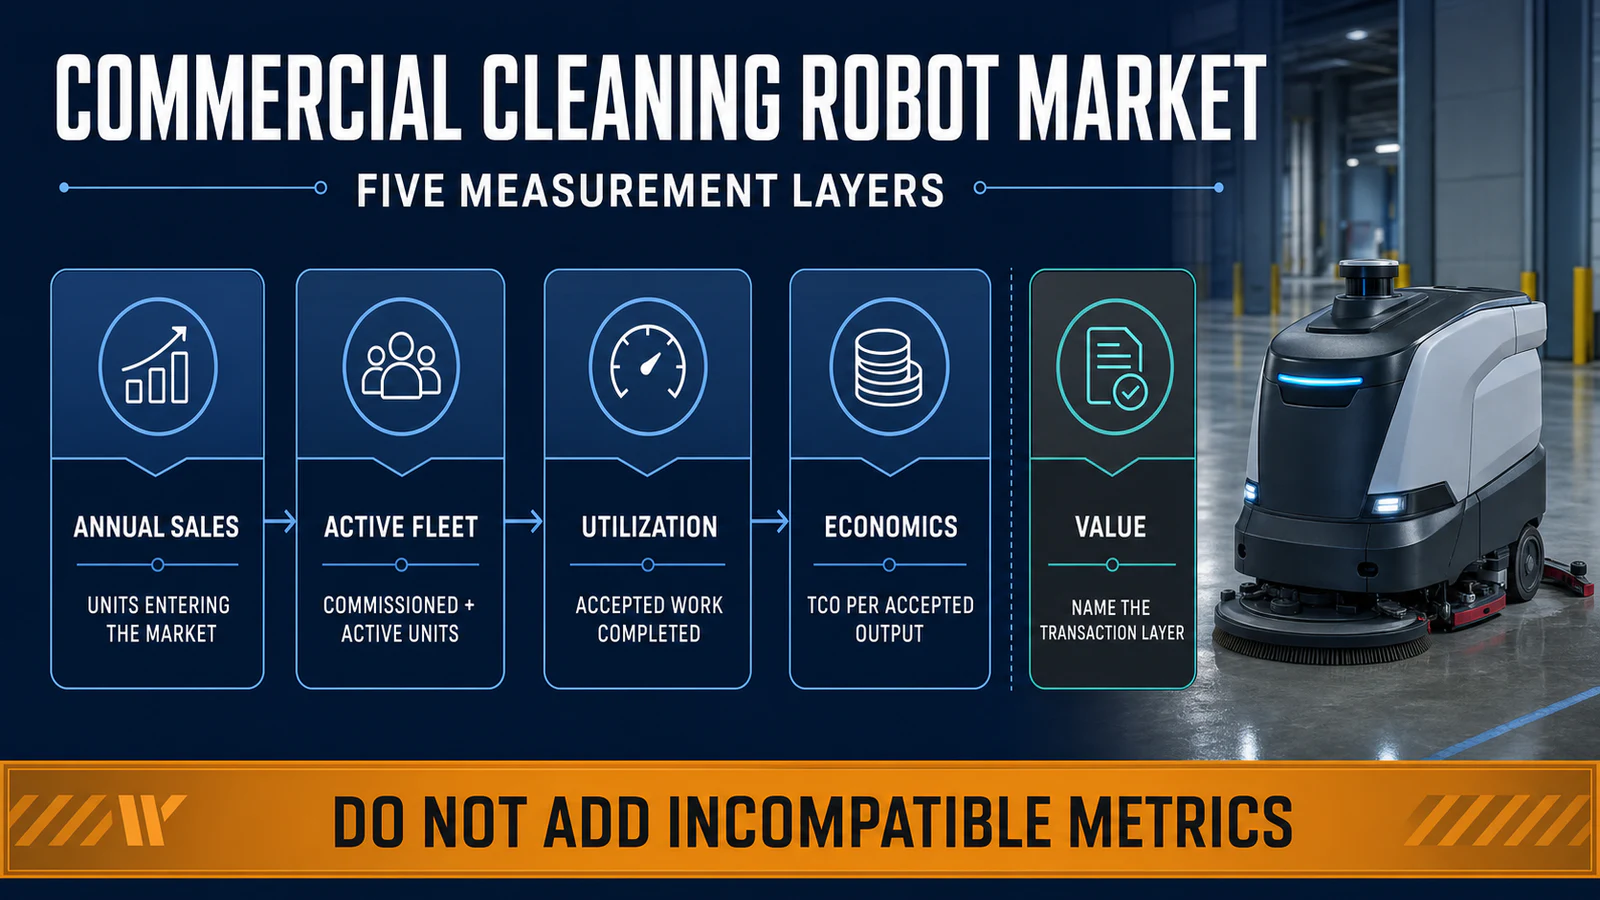
- Annual sales, transaction value, active fleet and utilization measure different stages of the commercial cleaning robot market.
- A credible adoption case links total program cost to accepted cleaning output and realized workload changes—not theoretical productivity.
In this article 15 sections
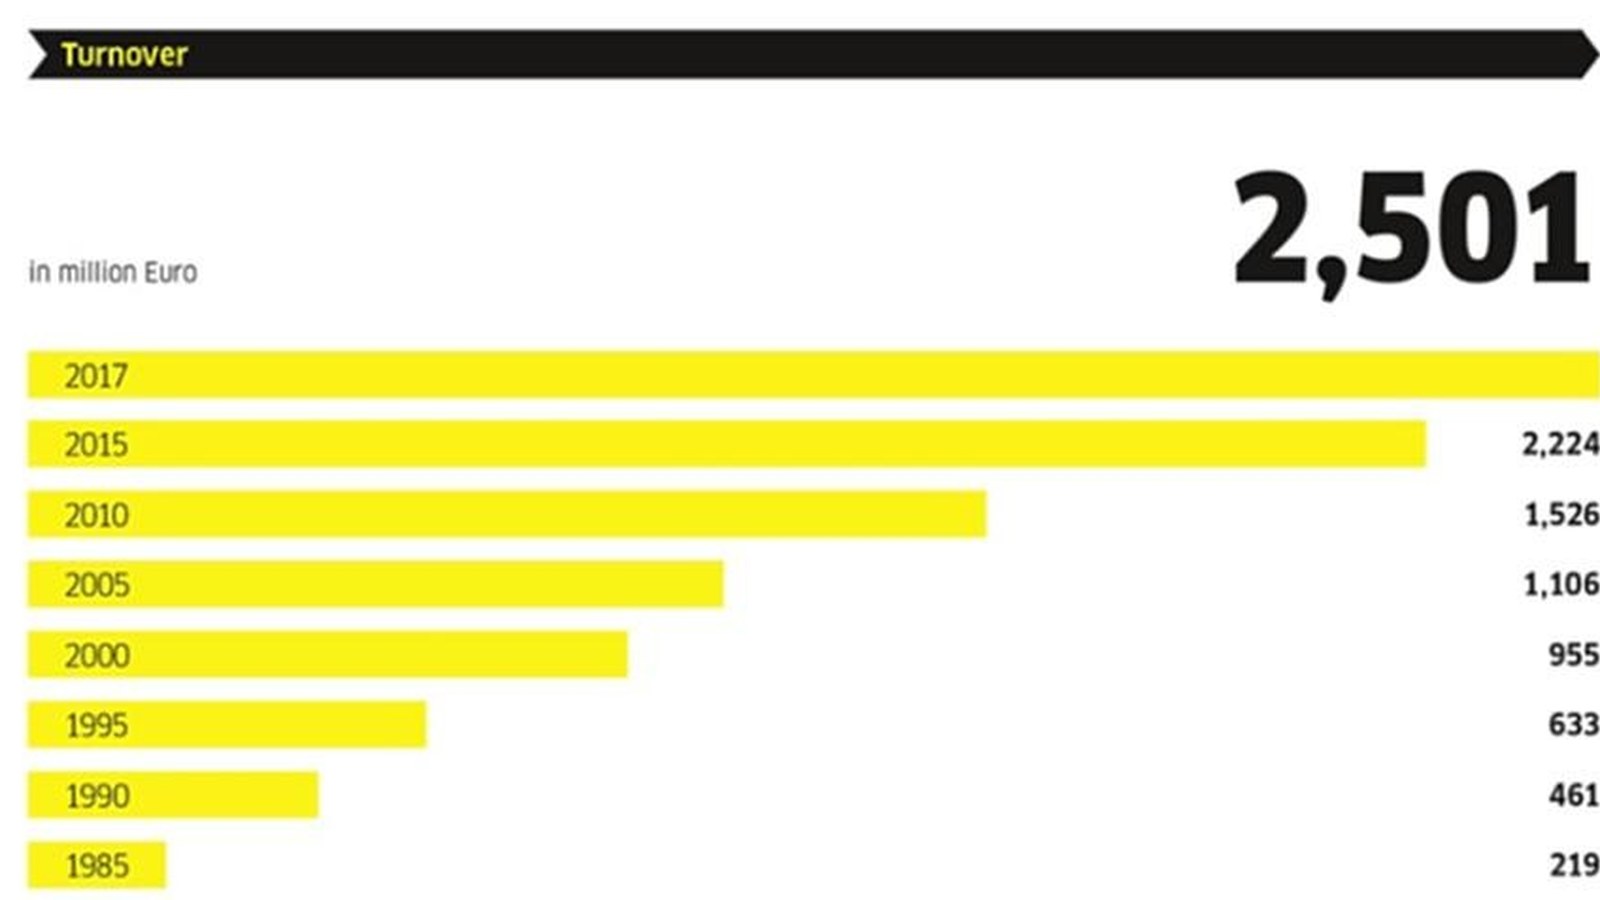
There is no single interchangeable commercial cleaning robot market-size figure. The International Federation of Robotics reported more than 25,000 professional cleaning robots sold in 2024, up 34%, but its data came from a changing supplier sample and was not projected to the whole industry. A useful market assessment must define the included robots, transaction layer and geography, then separate annual sales from active fleet, utilization and total cost of ownership.
Commercial cleaning robotics has moved beyond isolated demonstrations. Tennant announced its 10,000th robotic scrubber in June 2025, while autonomy platforms report fleets operating across thousands of commercial sites. Those milestones show real deployment. They do not establish one global installed base, because an OEM sale, a platform subscription and a dealer deployment can describe the same machine.
For manufacturers, distributors and facility buyers, the decisive market question is no longer whether commercial cleaning robots exist at scale. It is how much of that scale is active, productive and economically sustainable.
Commercial Cleaning Robot Market at a Glance
| Measure | Current public signal | What it establishes | Main limitation |
|---|---|---|---|
| Annual professional cleaning-robot sales | IFR reported more than 25,000 units for 2024, up 34% | A growing professional application class led by floor cleaning | Supplier-sample data, not a whole-industry projection |
| Professional service-robot RaaS fleet | IFR reported more than 24,500 units across professional service robotics in 2024, up 31% | Recurring access models are becoming more important | Not specific to cleaning robots |
| OEM cumulative sales | Tennant announced its 10,000th AMR in June 2025 | One equipment supplier has reached meaningful cumulative scale | Not an active-fleet count or market share |
| Autonomy-platform fleet | Brain Corp reported more than 37,000 AMRs in 2024 | A shared autonomy platform can operate at multi-OEM scale | Includes more than floor cleaning and can overlap OEM counts |
| Operating activity | Brain Corp reported more than 19 million autonomous hours and 250 billion square feet covered | Large fleets generate measurable operating activity | Company-reported cumulative data; area is not proof of cleaning quality |
These figures belong in separate columns. Adding them would count some machines more than once and mix annual sales with cumulative fleets.
What Counts as a Commercial Cleaning Robot?
The answer depends on the research question.
The IFR professional cleaning category is an application class within service robotics. Its 2025 summary says floor cleaning is the main application. This is narrower than many commercial market reports carrying the words `cleaning robot market`.
For example, the Fortune Business Insights report scope includes floor, lawn, pool and window-cleaning robots. It also combines personal and professional products across residential, commercial and industrial applications. A headline value from that universe cannot answer the size of professional floor-cleaning robotics.
Other reports draw a different boundary. The public Mordor Intelligence scope includes domestic robots and professional systems for floors, tanks, tubes, pipes and disinfection. Both taxonomies can support internally consistent research. They do not describe the same market.
For this article, a commercial cleaning robot is a robot sold or provided for professional cleaning work in a business, institutional or industrial setting. The core market is autonomous floor care. Specialist robots for facades, tanks or other defined cleaning tasks belong only when the source explicitly includes them. Household robot vacuums, residential pool robots and lawn robots remain outside the core scope.
That definition also keeps commercial cleaning robots separate from the wider industrial cleaning equipment market, which includes manual machines, pressure washers, extractors, vacuums and non-robotic floor-care equipment.
What Does the IFR 2025 Dataset Actually Measure?
The IFR World Robotics 2025 report page provides the most useful public unit benchmark. It reported almost 200,000 professional service robots sold in 2024. Professional cleaning ranked third among the major applications, with more than 25,000 units and 34% growth. Floor cleaning was the main use.
The methodology note matters as much as the headline. IFR says its service-robot data came from a sample of 294 suppliers, was not projected to the entire industry and used a sample whose composition changes each year. It explicitly discourages compiling or comparing data from different World Robotics editions.
That warning blocks a common shortcut. A reader cannot take the cleaning-robot total from the 2024 report, compare it with the 2025 report and present the difference as a like-for-like global market growth rate. IFR’s own reported 34% growth can be cited within the 2025 dataset. A new calculation across changing report samples cannot.
The executive summary also places the industry in context. IFR knew of 944 service-robot producers worldwide and described 80% as small or medium-sized companies with no more than 500 employees. That total covers service robotics broadly and excludes system integrators. It is not a count of commercial cleaning-robot manufacturers.
Why Published Cleaning Robot Market Sizes Differ
The report title rarely reveals the complete denominator. Before comparing two market values, align the following fields:
| Field | Questions to ask |
|---|---|
| Product scope | Floor only, or also pool, lawn, window, facade and specialist cleaning? |
| User | Consumer, professional or both? |
| Operating mode | Autonomous, semi-autonomous, remote-controlled or all three? |
| Metric | Units, shipments, installed fleet, subscriptions, revenue, GMV or end-user spend? |
| Value layer | Manufacturer, distributor, dealer, platform or final customer? |
| Business model | Purchase, rental, lease, RaaS or software contract? |
| Geography | Production origin, shipment destination or customer market? |
| Time | Observed year, current estimate or forecast? |
| Method | Supplier sample, company model, customs data, channel interviews or public filings? |
A broad consumer-and-professional report can produce a much larger dollar figure than a professional floor-cleaning study. A report that measures end-user spend can exceed manufacturer revenue because distribution, installation and service sit between the two values. Neither result is automatically wrong.
The error starts when the analyst removes the definition and keeps only the largest number.
Unit Sales, Market Value, Active Fleet and Usage Are Different Metrics
Each layer answers a separate commercial question.
Annual flow
Unit sales and shipments show how many machines entered a defined channel during a period. They support production planning and component demand. They do not show whether a machine reached an end user, remained active or replaced an older robot.
RaaS additions need their own line. A robot entering a subscription fleet is not always recorded like a conventional equipment sale, and the recurring contract value cannot be treated as the full equipment price.
Transaction value
Manufacturer revenue, distributor sell-in, dealer revenue and end-user spend sit at different points in the chain. Adding them double-counts the same equipment.
Recurring software and service add another layer. A useful value estimate must state whether the figure includes deployment, fleet software, maintenance and financing. If that treatment is unclear, the number cannot be compared with an equipment-only series.
Installed and active fleet
Cumulative sales count every unit delivered since a chosen start date. An installed fleet should remove products that were returned or never commissioned. An active fleet should go further and require qualifying activity during the reporting period.
The distinction becomes important in a young category. A robot in a storage room remains part of cumulative sales. It does not represent current cleaning capacity.
Utilization
Operating hours, completed routes and cleaned area show whether robots entered the daily workflow. Utilization still needs a defined denominator.
A high autonomous share can look impressive if the machine is scheduled for only a small portion of the available workload. A large mapped area can also overstate output when routes are interrupted or the result fails inspection. The strongest operating metric is accepted work completed against a planned task.
The Supplier Stack Creates Double-Counting Risk
A commercial cleaning robot can carry several company names without being several machines.
| Layer | Commercial role | Typical reported number |
|---|---|---|
| Equipment OEM | Builds and sells the cleaning machine | Units sold or cumulative shipments |
| Autonomy platform | Provides navigation, fleet software and updates | Subscribed or connected robots |
| Distributor or integrator | Sells, deploys and supports the system | Customer sites or deployments |
| Service provider | Maintains the machine or sells cleaning outcomes | Contract fleet or service locations |
| Facility operator or BSC | Uses the robot inside a cleaning program | Active units, hours and accepted output |
Tennant announced its 10,000th AMR in June 2025. Brain Corp reported more than 37,000 AMRs powered by its platform in 2024. Some BrainOS-powered floor-care machines were sold by OEM partners, so the two figures cannot be added.
The Brain Corp total also spans more than cleaning. Its platform supports floor-care and environmental-sensing applications. The company’s 19 million autonomous hours and 250 billion square feet are evidence of operating scale across its reported fleet, not a global cleaning-robot installed base.
Market-share calculations need a de-duplicated numerator and a compatible denominator. Public milestone releases rarely provide both.
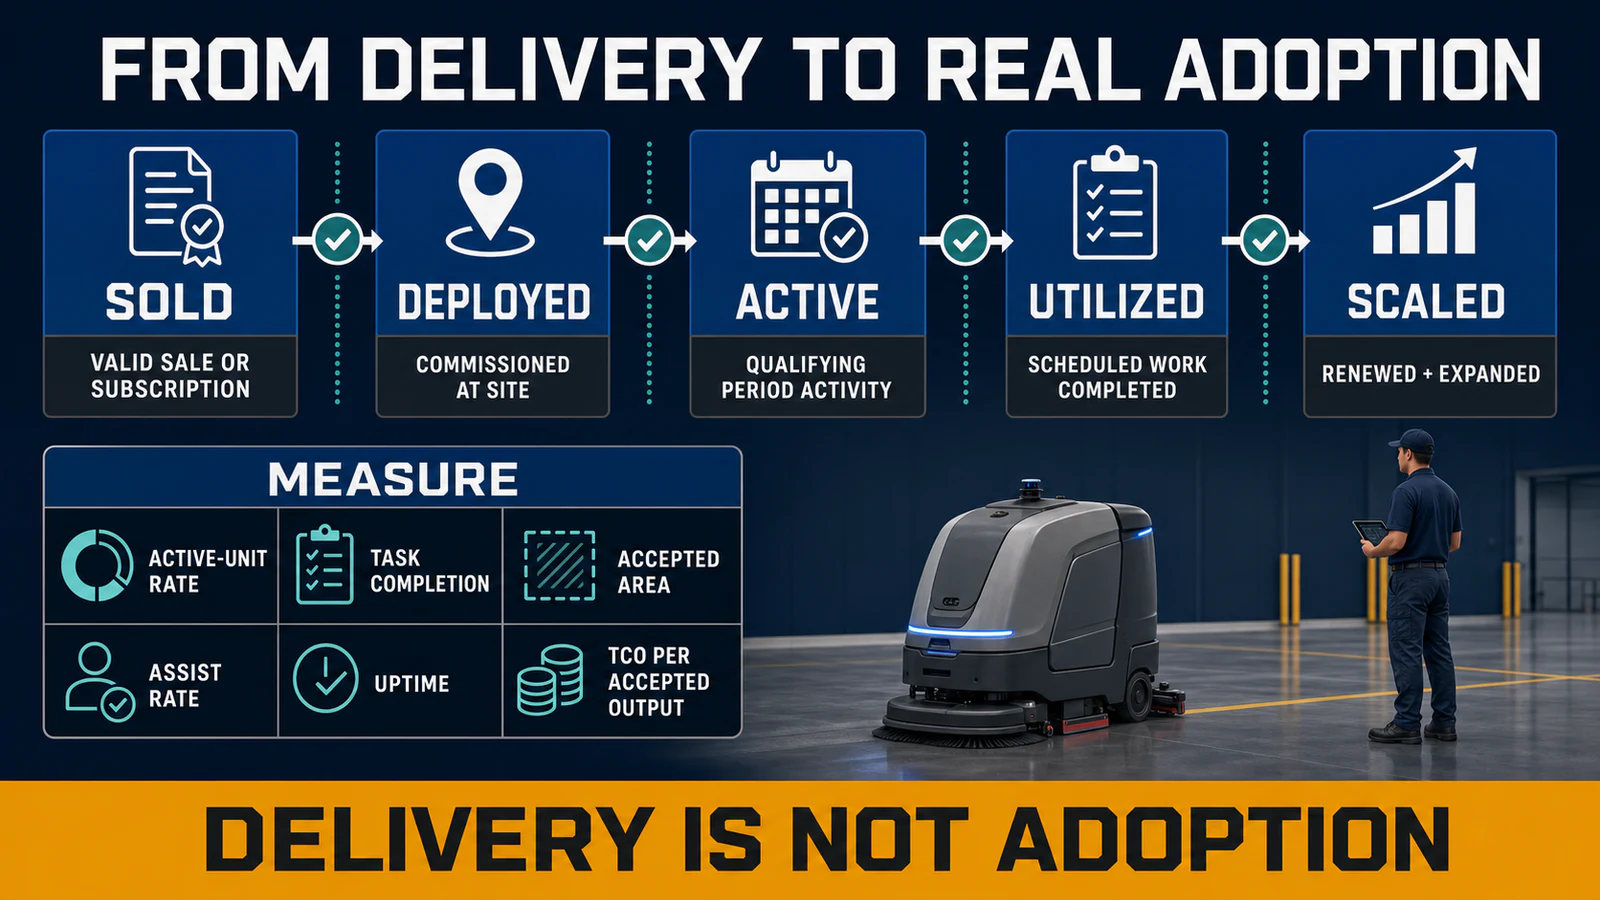
A Robot Is Not Adopted Just Because It Was Delivered
Commercial adoption has several stages:
| Stage | Minimum evidence | Remaining question |
|---|---|---|
| Announced | Product, partnership or pilot disclosed | Was it paid and delivered? |
| Sold or subscribed | Valid sale or recurring contract | Was it commissioned at a customer site? |
| Deployed | Machine configured and able to run | Is it still active? |
| Active | Qualifying activity in the reporting period | Does it complete enough scheduled work? |
| Utilized | Sustained task completion | Are outcomes accepted and costs controlled? |
| Scaled | Multi-site expansion or operating standard | Does the customer renew and support the fleet? |
This is a World Clean Biz measurement framework, not an IFR classification.
The industry has public evidence at several levels. Tennant’s cumulative sales milestone establishes OEM scale. Brain Corp’s fleet activity establishes platform usage. A 2026 ISSA industry report also described robots sitting unused after buyers acquired equipment without designing the operating program.
That observation is not an estimate of industry-wide idle inventory. It identifies the measurement gap: delivery records demand; repeated accepted output records adoption.
How to Measure Total Cost of Ownership
Total cost of ownership covers the full operating period, not the machine price or subscription payment alone.
`TCO = equipment or subscription + deployment + site preparation + software/connectivity + maintenance/parts + consumables/utilities + supervision/assists + downtime/backup + financing/insurance + end-of-life`
The cost stack changes with the business model. A purchased machine places more capital and residual-value risk with the buyer. Rental or RaaS converts part of the cost into recurring payments, but deployment, operator time and uncovered service can remain.
The Nilfisk autonomous-cleaning guide identifies initial price, operation, maintenance and repairs as cost categories. It also discusses labor, water and detergent as potential savings. The guide presents a typical 14-to-24-month ROI and a ten-year equipment life, but those are supplier assumptions—not universal outcomes.
The defensible denominator is accepted output:
`Cost per accepted cleaning area = total program cost ÷ accepted cleaned area`
Accepted area is the floor area completed to the site’s defined result. It is not the machine’s theoretical hourly rating, the map loaded into a dashboard or every square foot crossed during an incomplete route.
Labor Savings Require a Workload Change
A robot running for one hour does not automatically save one labor hour.
The existing cleaning plan must show which task moved to the robot, what human assistance remains and where the released time went. If the employee continues shadowing the machine, repeatedly rescues routes or performs the same floor task afterward, the recorded autonomous hour overstates the realized labor value.
A practical calculation is:
`Realized labor value = verified hours removed from the old workload and productively reassigned or avoided × full-burden labor rate`
The ISSA robotic-deployment guidance makes the same operational point: buyers need a workload baseline and a redesigned route plan. It warns that robot time is not an hour-for-hour comparison with human labor.
Vendor case studies can show what a completed program looks like, but they remain case-specific. A Brain Corp case study says Veritiv reallocated 14,000 worker hours across 23 locations and projected US$3.4 million in savings over ten years. That result should not become an industry benchmark. Its value is the connection between multi-site deployment, workload reallocation and operating data.
Which Operating KPIs Show Real Adoption?
Manufacturers and operators need a compact set of compatible measures.
| KPI | Recommended definition | Common distortion |
|---|---|---|
| Active-unit rate | Units with qualifying activity ÷ commissioned units | Using cumulative shipments as the denominator |
| Scheduled utilization | Autonomous productive time ÷ scheduled robot workload | Dividing by all calendar hours |
| Task completion | Completed scheduled routes ÷ assigned routes | Counting starts rather than completions |
| Accepted area | Area passing the site’s result criteria | Reporting map size or theoretical coverage |
| Assist rate | Human interventions ÷ completed missions | Omitting brief rescues and route restarts |
| Uptime | Available operating time ÷ scheduled time | Excluding charging, service or connectivity failures inconsistently |
| Cost per accepted area | Total program cost ÷ accepted area | Using purchase price as total cost |
| Expansion and renewal | Sites or units renewed and expanded | Treating an announced pilot as retained business |
One KPI cannot carry the whole adoption claim. High utilization with poor results is not success. Clean results with excessive supervision do not establish scalable economics.
How Manufacturers and Distributors Should Read the Market
A supplier needs more than a global CAGR.
Annual unit flow indicates production opportunity. The active fleet indicates recurring demand for software, service and parts. Utilization shows whether customers are likely to expand rather than store the machine. Renewal and multi-site growth provide stronger evidence than a large pipeline of short pilots.
The supplier should also separate first-time adoption from replacement. A mature installed base creates service and replacement demand, while a young market depends more heavily on deployment support. Combining both can hide whether new customers are entering the category.
Distribution capacity belongs in the market model. A manufacturer can ship into a country without having enough trained partners to survey sites, commission machines and restore service. Market access and operating coverage are different assets.
How Facility Buyers Should Build a Business Case
The buyer does not need a global market-size number to approve one deployment. The business case needs a site-specific baseline:
- Define the eligible floor area and current cleaning workload.
- Record actual labor, equipment and service cost for that workload.
- Measure route completion, accepted area and human assists during the evaluation.
- Rebuild the work plan and count only labor time actually released.
- Add the complete robot cost stack, including downtime and backup.
- Compare purchase, rental and RaaS on the same operating period.
- Set expansion gates before the first unit is ordered.
The autonomous floor scrubber guide covers site fit, pilot design, safety and procurement in detail. The rent, lease or buy guide provides a separate framework for financing and service responsibility.
Market-Data Audit Checklist
Before citing a commercial cleaning robot market figure, record:
- original source and publication date;
- data year and forecast year;
- product and user definition;
- observed, estimated or forecast status;
- units, value or installed-base metric;
- transaction layer and business model;
- geography and channel;
- sample and projection method;
- treatment of inactive and replacement units;
- possible overlap with OEM, platform or distributor data.
If the source does not disclose these fields, keep the estimate isolated. Do not average it with another report to create artificial precision.
FAQ
What is the commercial cleaning robot market size?
There is no single interchangeable figure. IFR reported more than 25,000 professional cleaning robots sold in 2024, up 34%, but the result came from a sample of 294 service-robot suppliers and was not projected to the whole industry. Dollar estimates vary because report scopes and transaction layers differ.
How many professional cleaning robots are sold each year?
IFR’s current public benchmark is more than 25,000 units for 2024. The main application was floor cleaning. The figure is sample-based and should be cited with the IFR methodology note.
How fast is the professional cleaning robot market growing?
IFR reported 34% growth for professional cleaning robots within its 2025 dataset. Do not calculate a separate growth rate by comparing totals from different IFR editions because the supplier sample changes.
What products are included in the cleaning robot market?
It depends on the source. Some reports combine floor, pool, lawn and window robots across consumer and professional applications. A commercial cleaning robot analysis should define its professional scope before using a market value.
What is the total cost of ownership of a cleaning robot?
TCO includes the equipment or subscription, deployment, software, maintenance, consumables, supervision, downtime and end-of-life cost over the selected period. The useful output measure is cost per accepted cleaning area, not purchase price per theoretical square foot.
How should cleaning robot adoption be measured?
Track commissioned units, active units, scheduled utilization, completed tasks, accepted area, assist rate and renewal or expansion. A delivered machine is not proof of sustained adoption.
Can OEM and autonomy-platform fleet figures be added together?
No, unless the underlying machines are de-duplicated. An OEM can sell a robot powered by a third-party autonomy platform, causing one machine to appear in both companies’ totals.
Which cleaning robot market report should a buyer trust?
Prefer a source that discloses product scope, data year, metric, value layer, geography, sample and methodology. Use incompatible reports as separate scenarios, not values to average.
Final Takeaway
The commercial cleaning robot market has reached meaningful unit and operating scale. The public evidence is still fragmented across supplier samples, OEM milestones and platform activity.
The strongest market statement therefore carries its denominator with it:
Define the robot. Name the value layer. Separate sales from active use. Measure accepted output. Then calculate TCO.