- Groupe SEB’s strength comes from portfolio depth, global brands and disciplined channel management.
- The 2018 report reflected both global macro pressure and the rise of e-commerce-driven retail.
- For cleaning appliance companies, SEB remains a reference for multi-brand and multi-category operations.
The French small appliance giant SEB Group released its annual report for 2018, and I have excerpted some important data for reference.
First, the topic is "A Good Year," SEB's performance in 2018 was satisfactory.
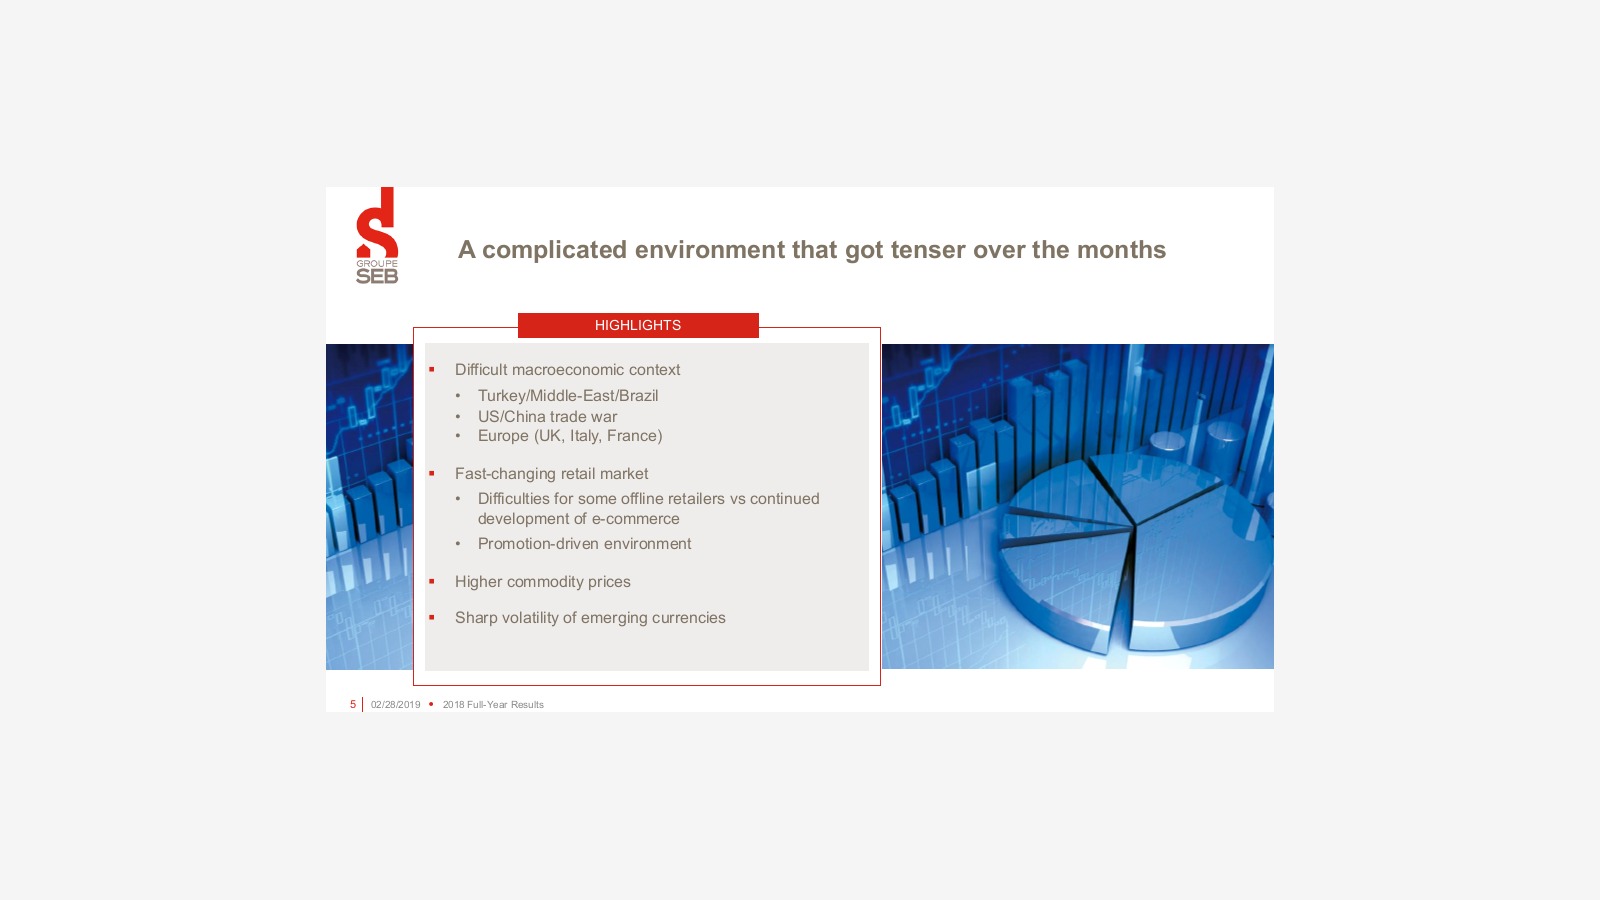
Difficult and Complex International Environment:
Turkey/Middle East/Brazil
US-China Trade War
Europe (UK, Italy, France)
Dynamic Retail Market:
Traditional Offline Retail vs. Developing E-commerce
Promotion-Driven Market Conditions
High Prices of Goods
Continuously Evolving Emerging Markets
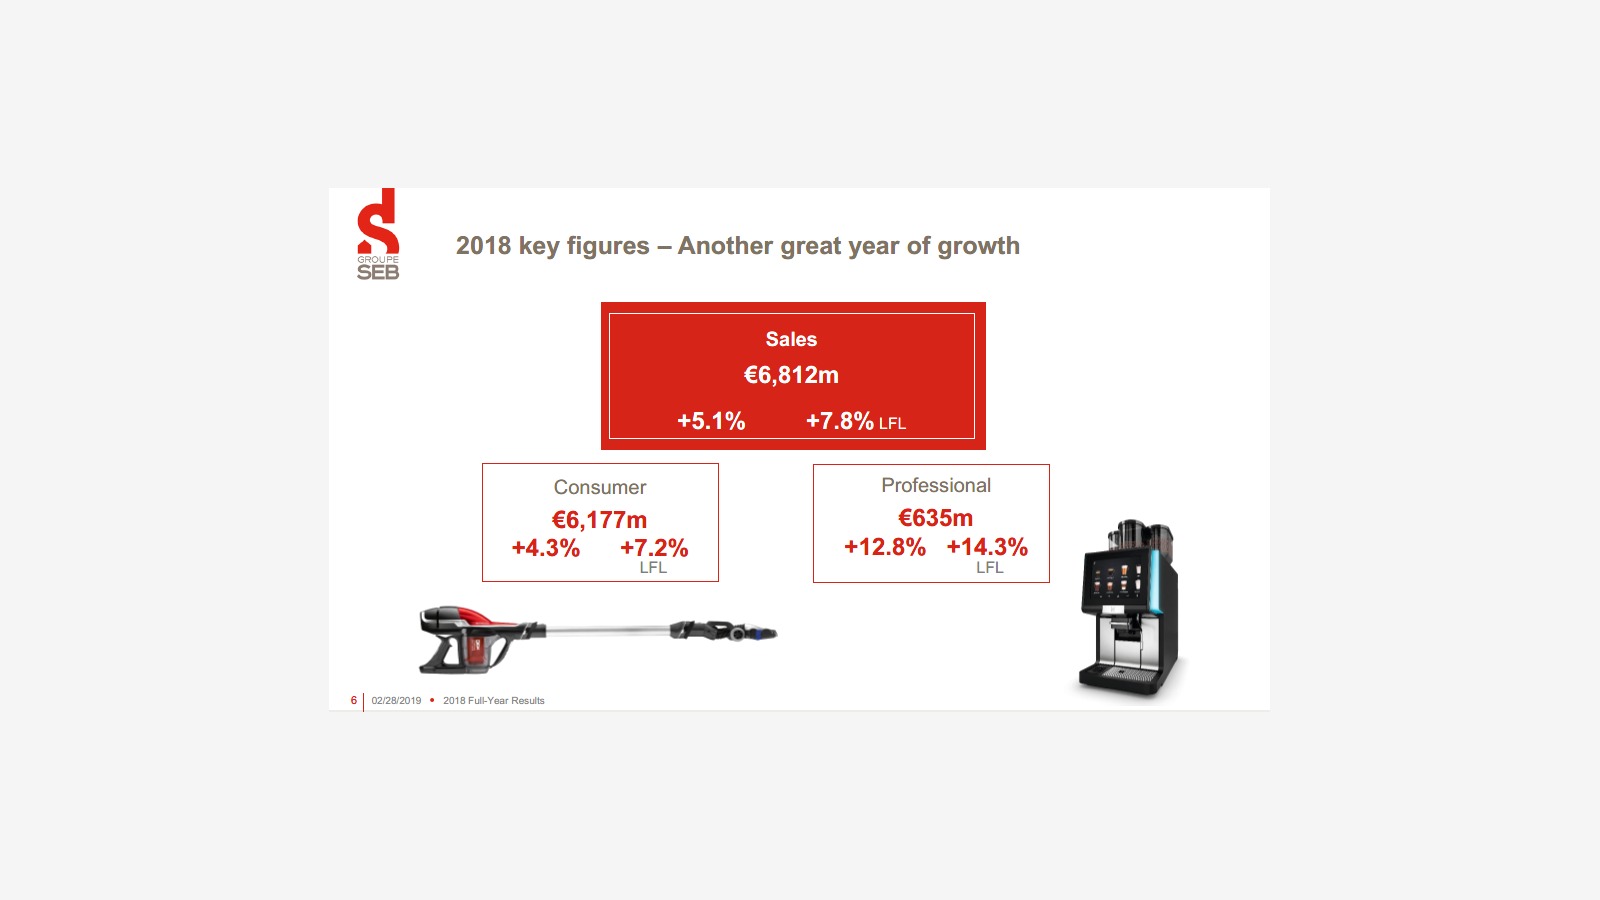
Sales grew by 5%, reaching €681.2 million, with consumer-grade sales increasing by 4.3% to €617.7 million and professional-grade sales growing by 12.8% to €63.5 million.
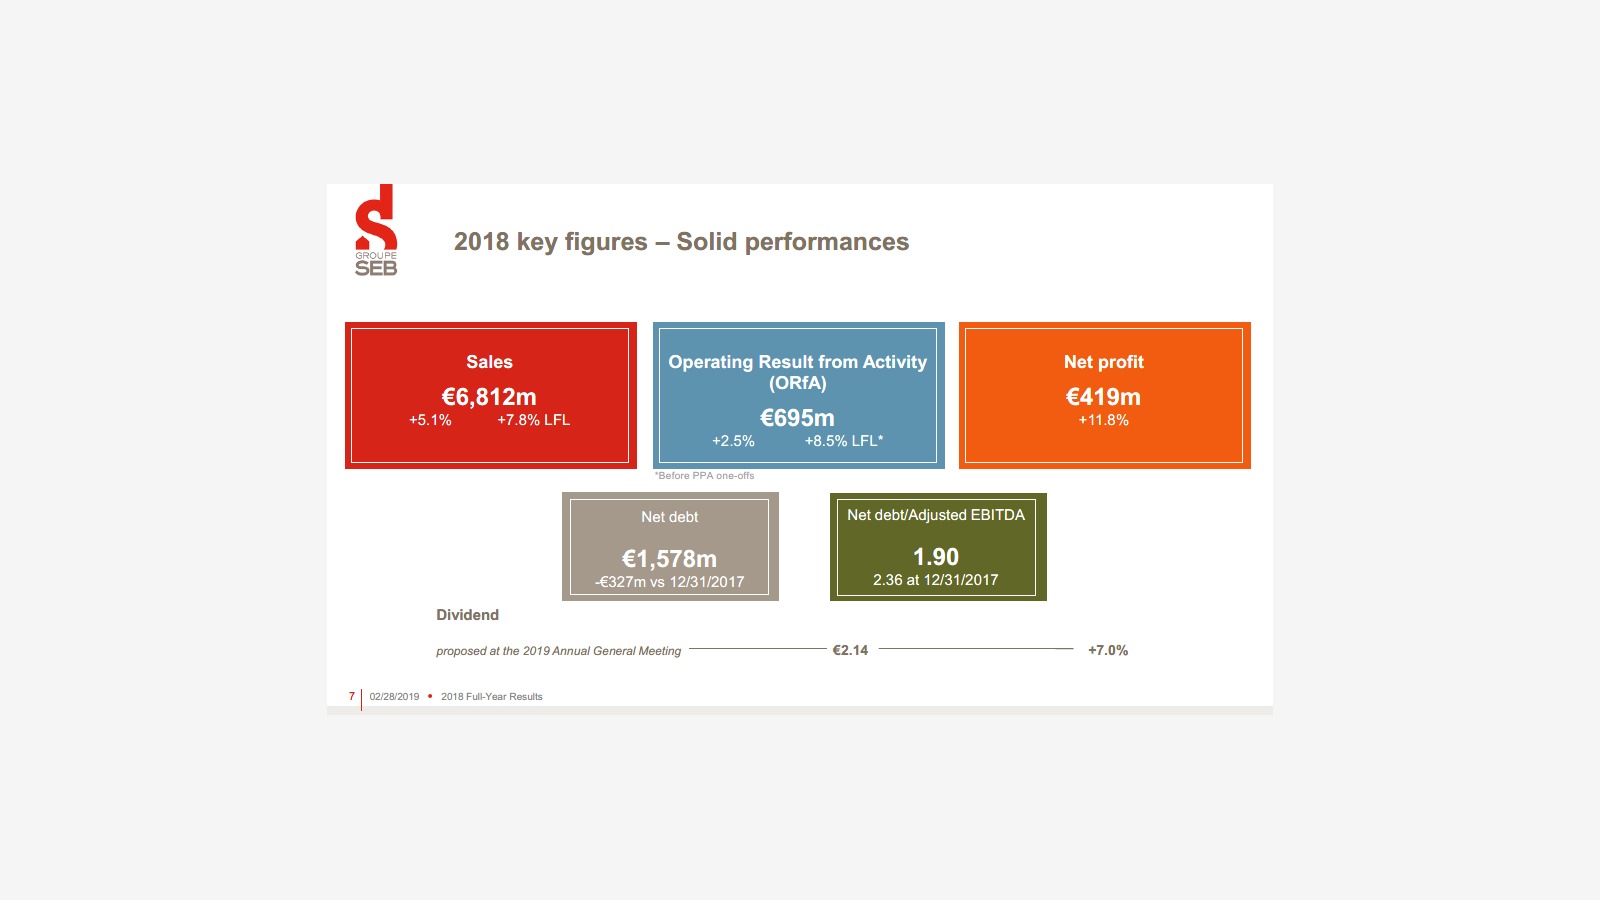
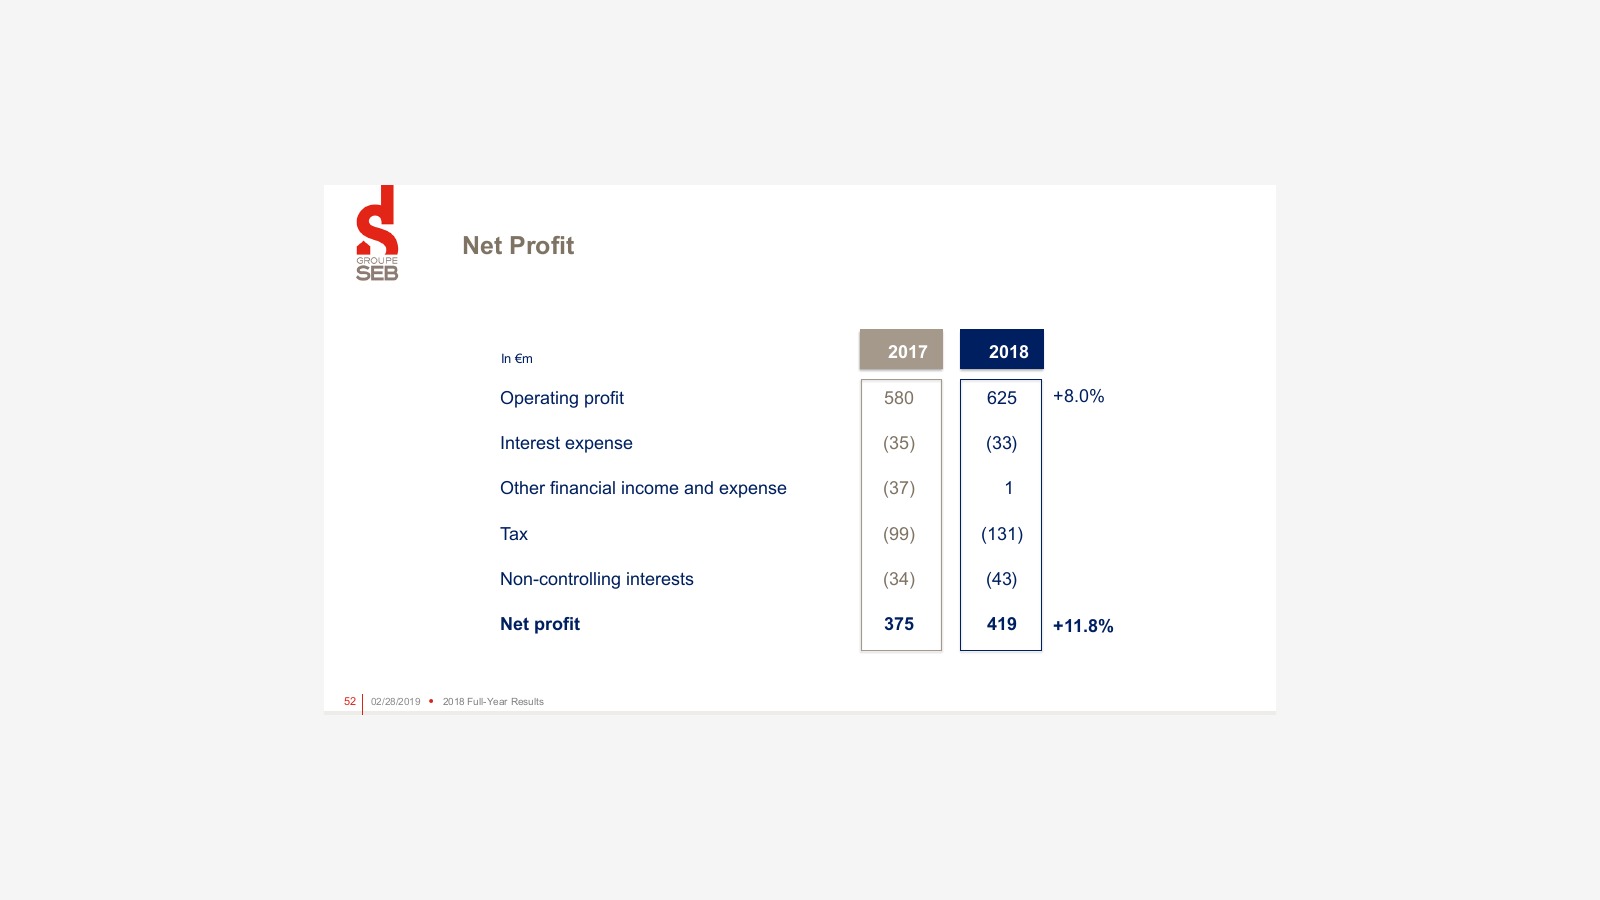
Overall Data: Sales grew by 5.1% to €681.2 million, while net profit increased by 11.8% to €419 million.
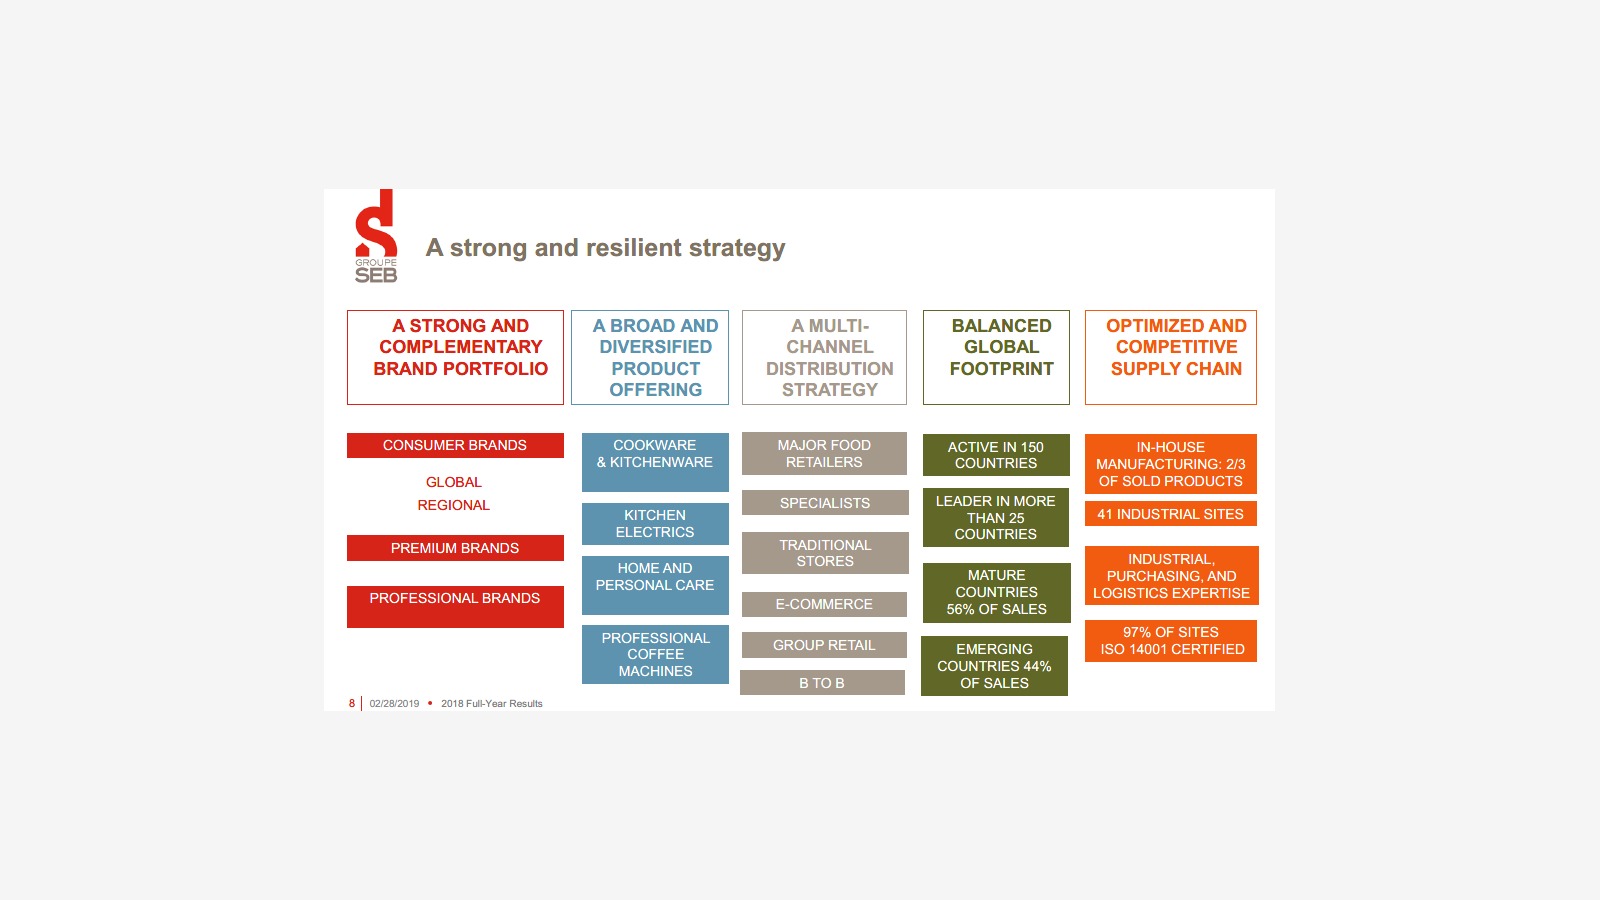
Some strategies, such as brand distribution, category distribution, sales channels, and so on.
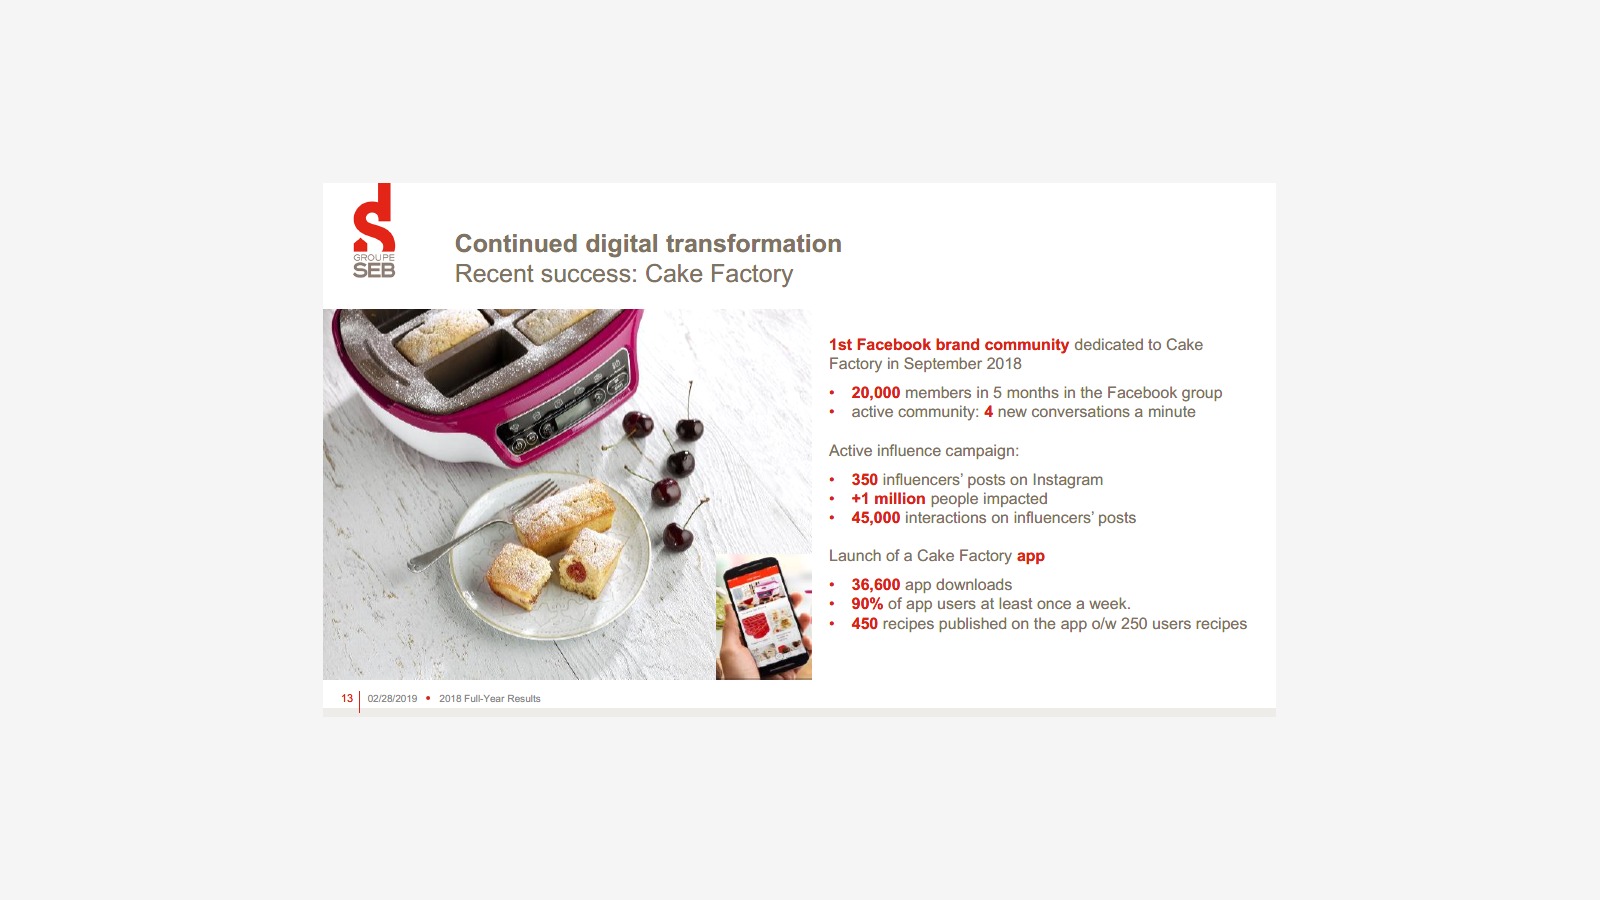
Some Internet Data
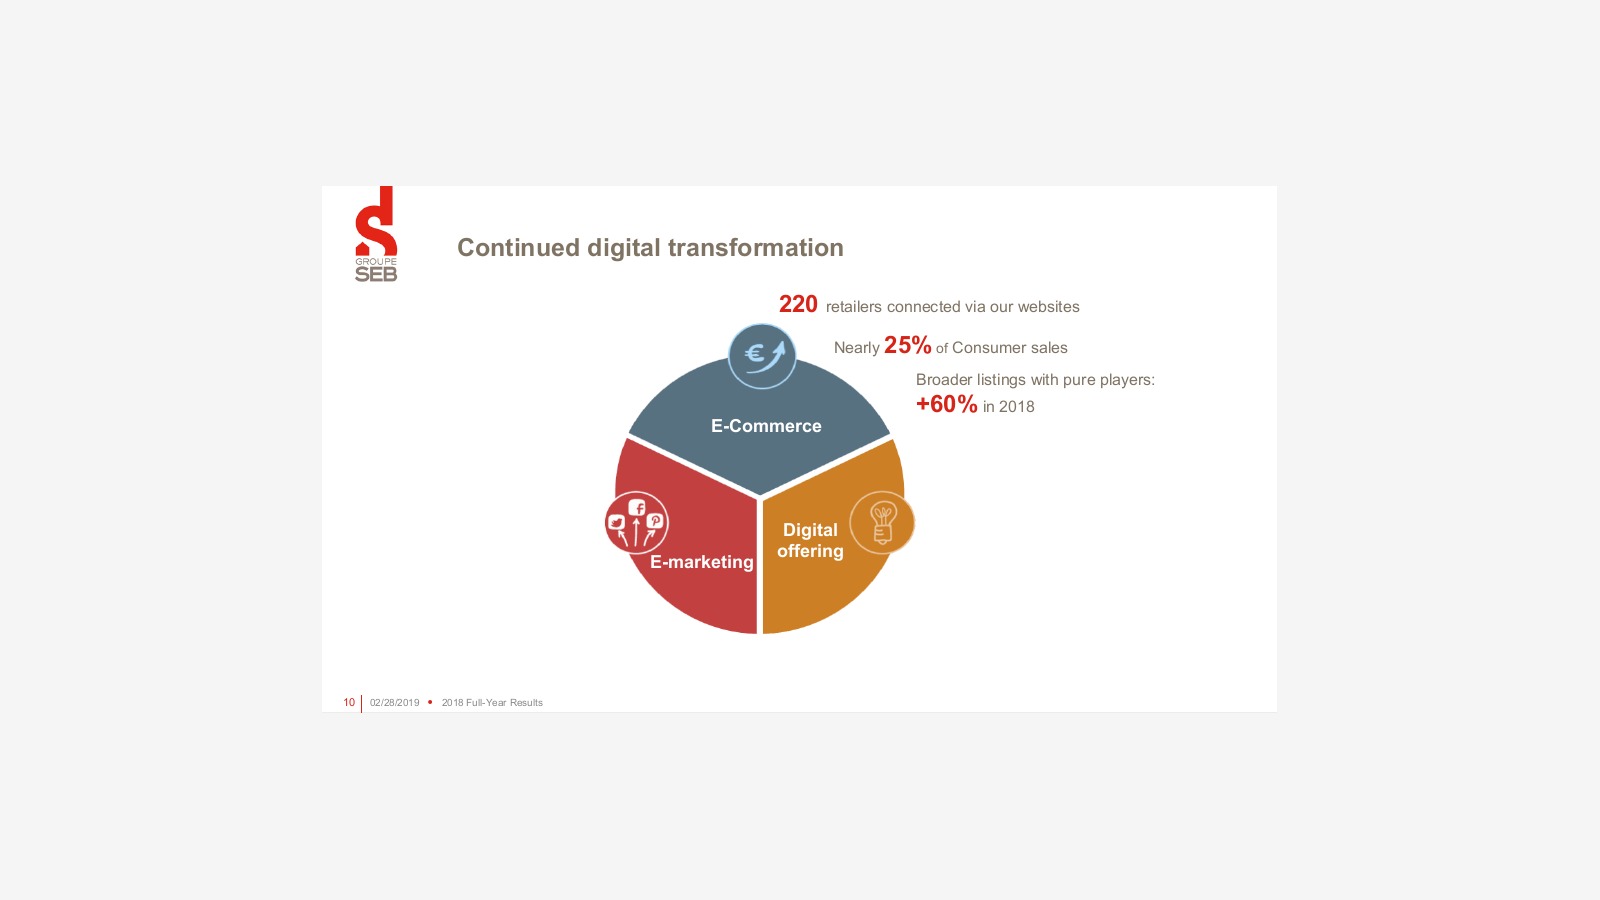
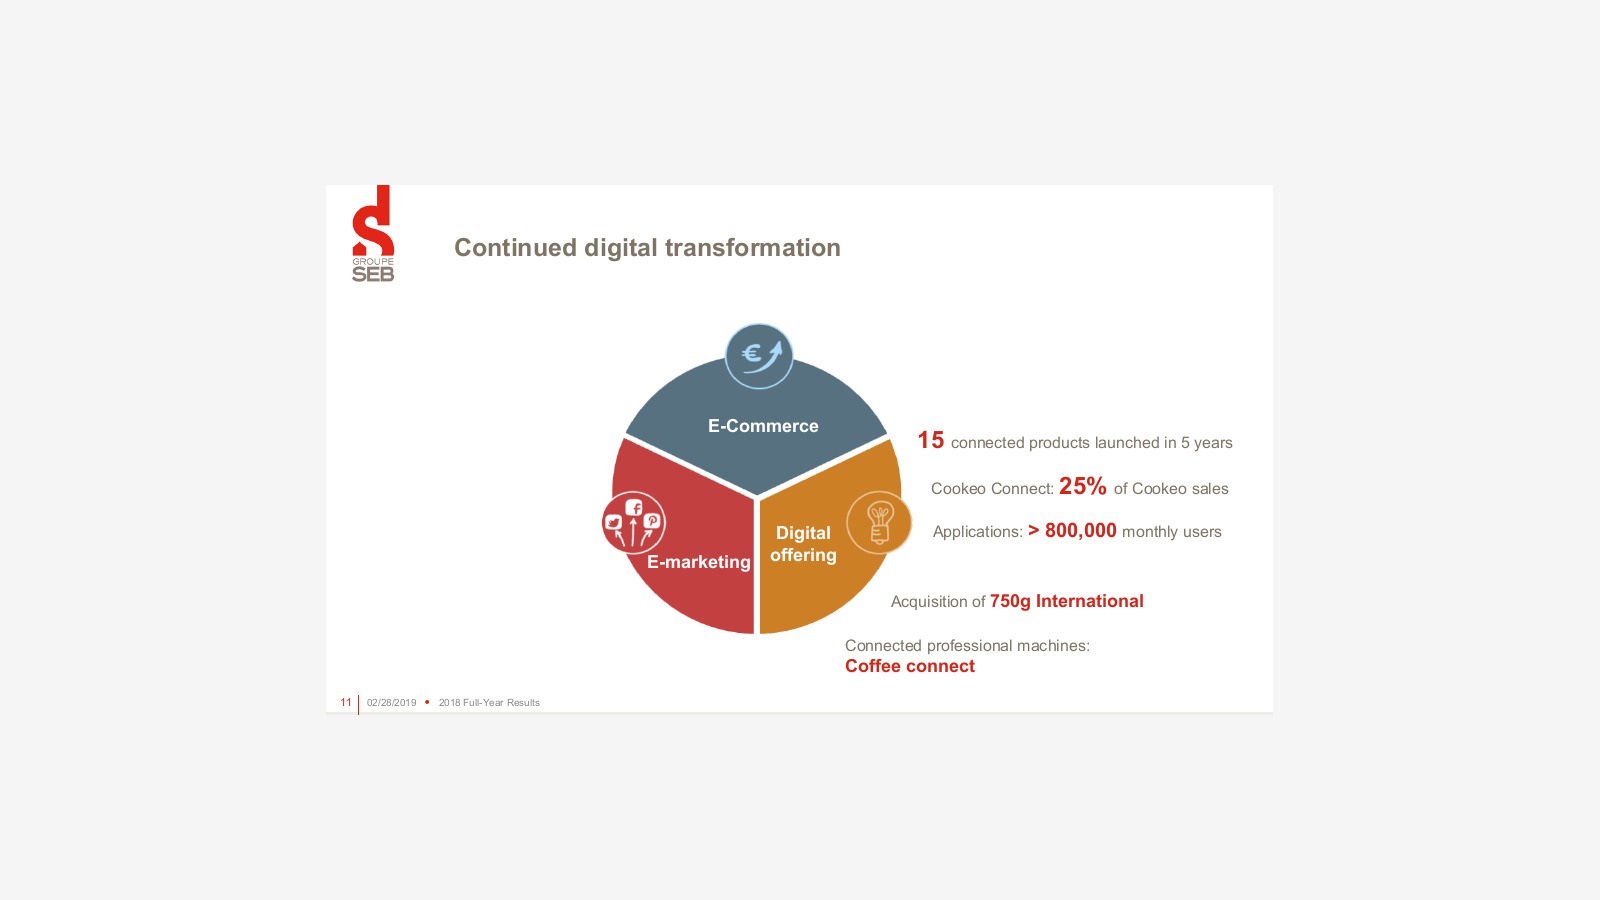
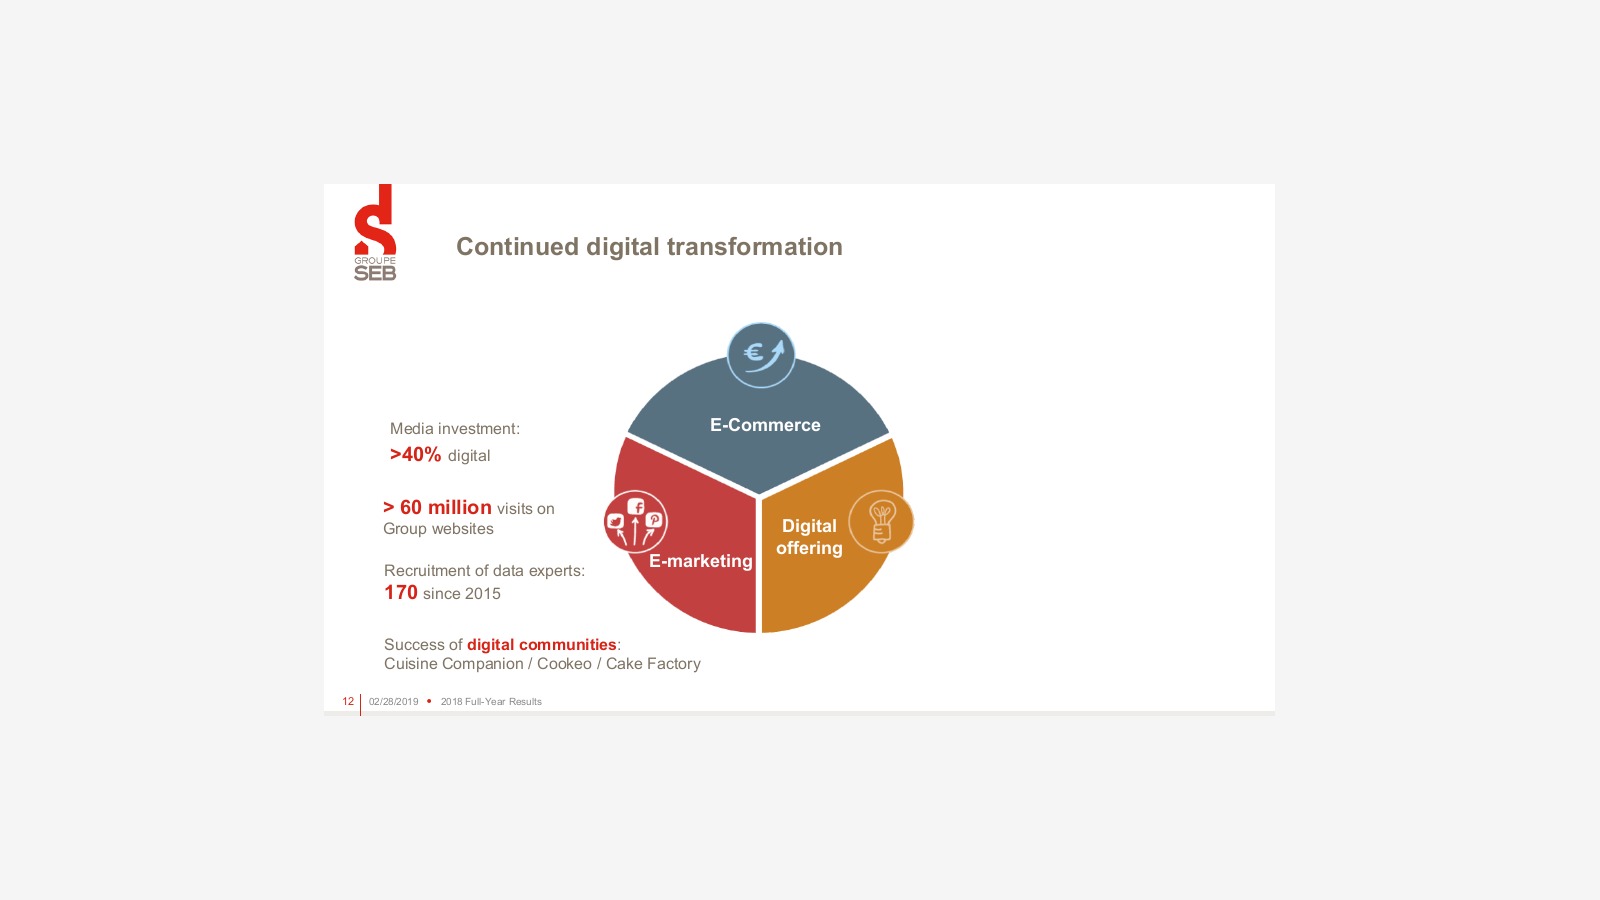
Marketing Performance Online
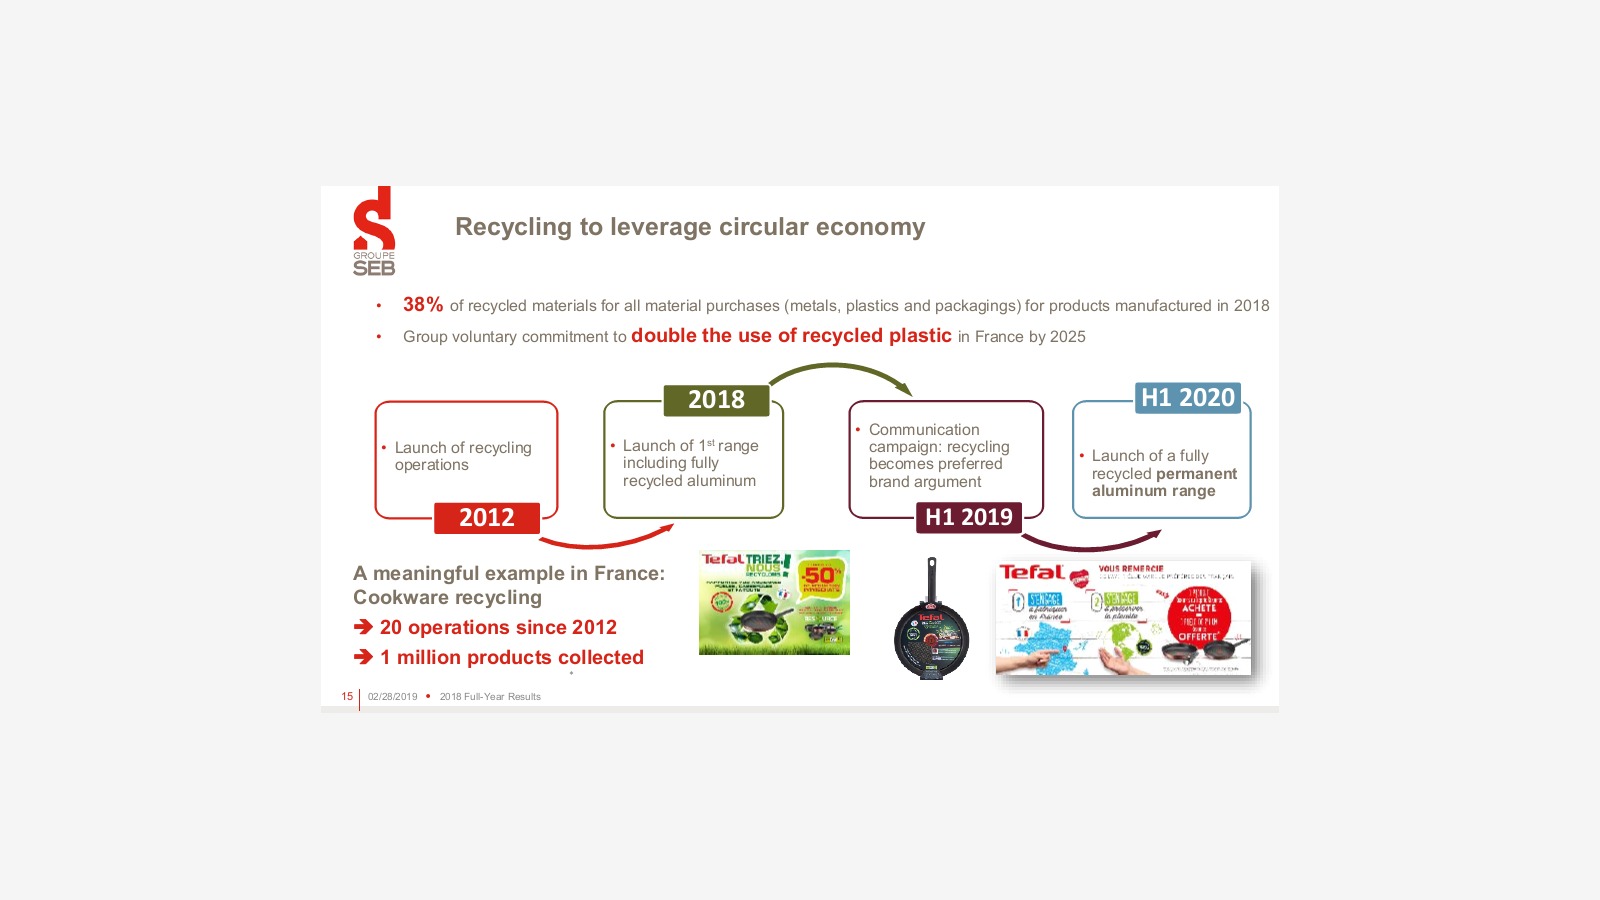
Performance Related to Environmental Protection
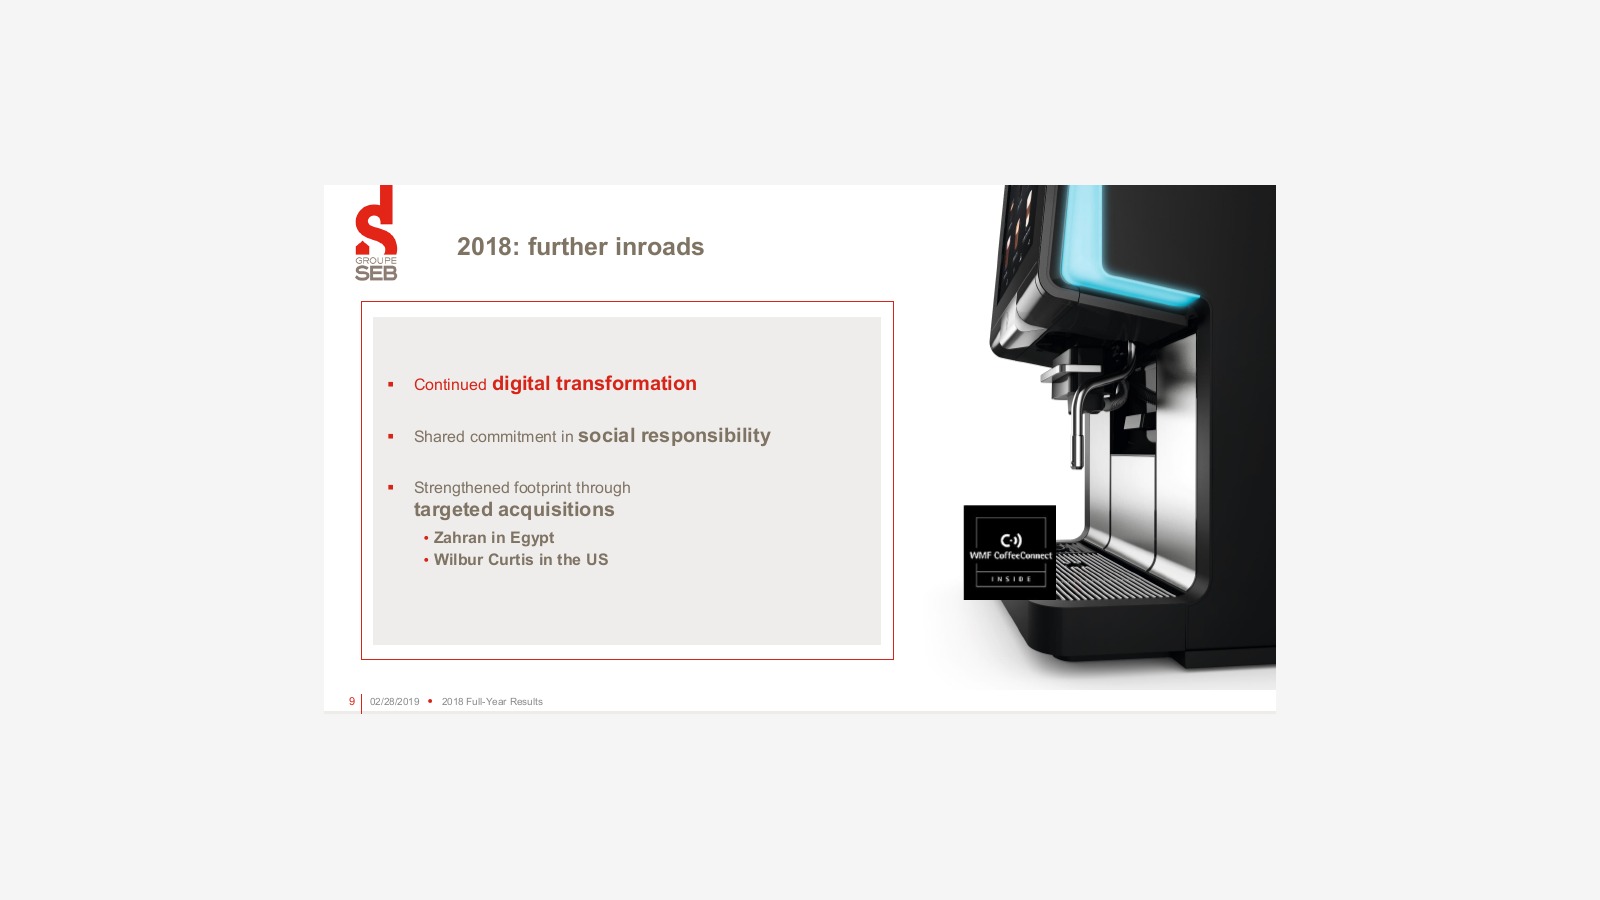
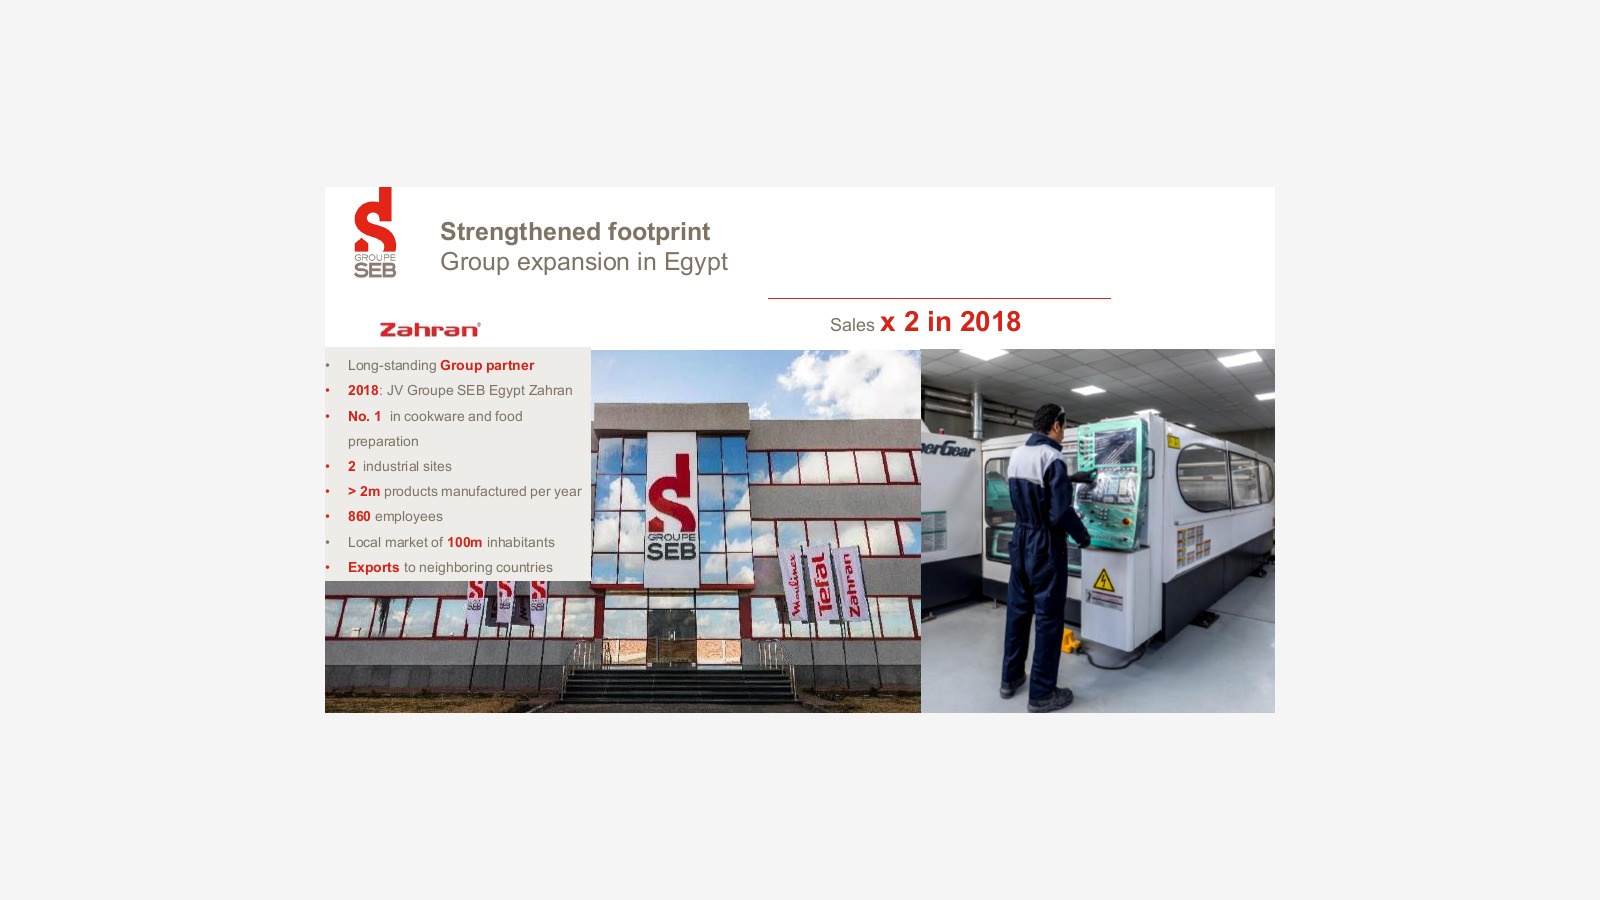
Achievements in Expanding the Egyptian Market:
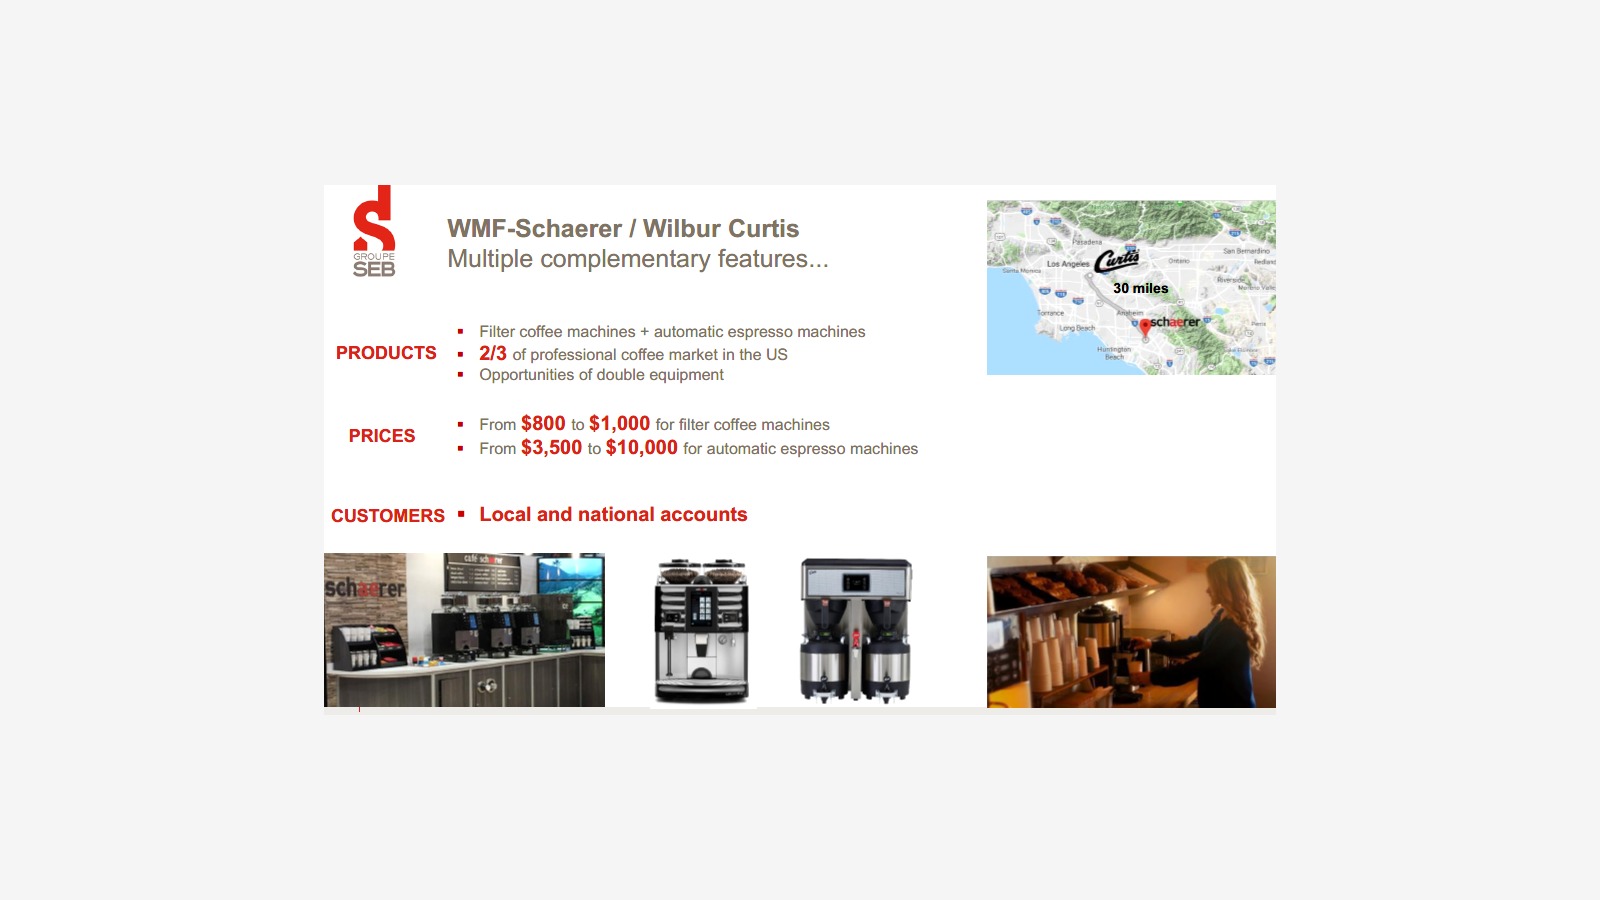
Some Achievements of WMF
(
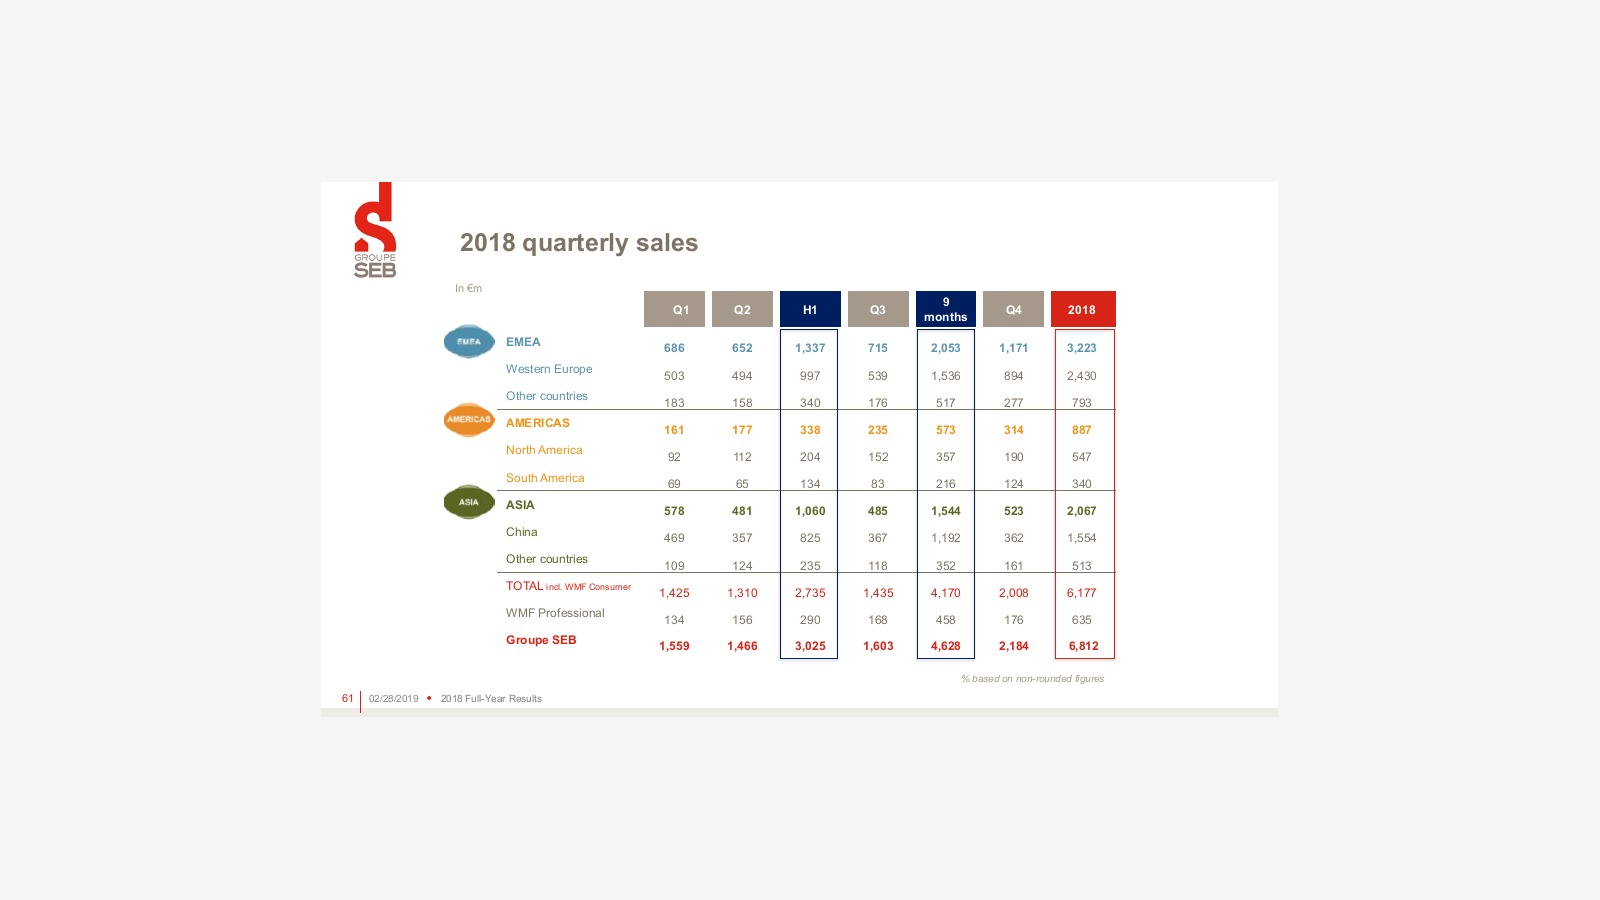
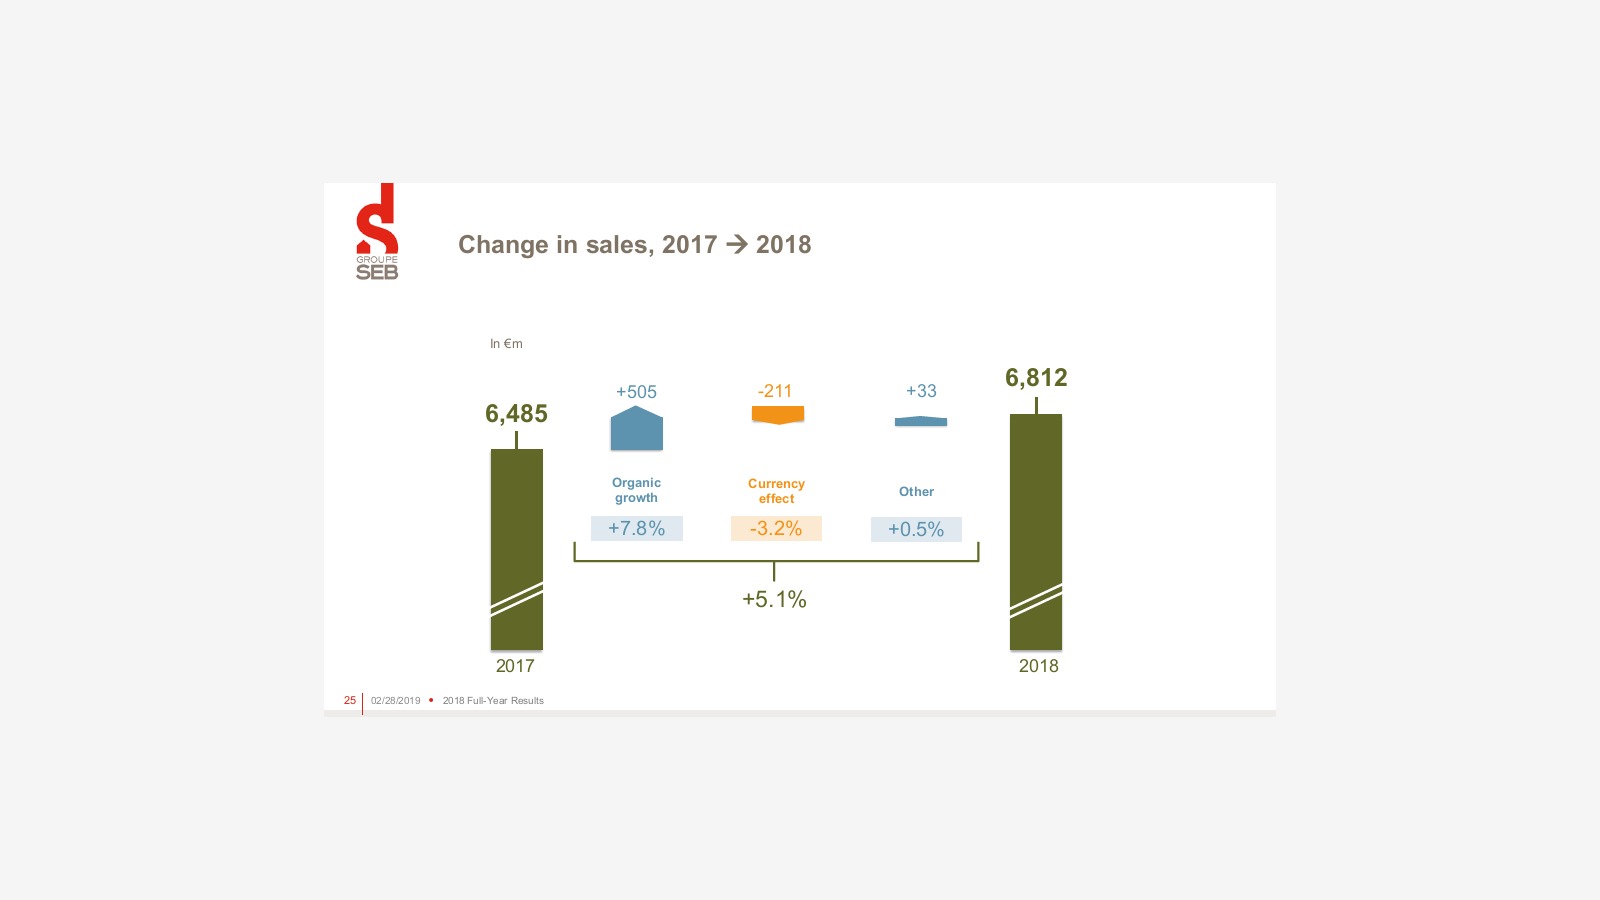
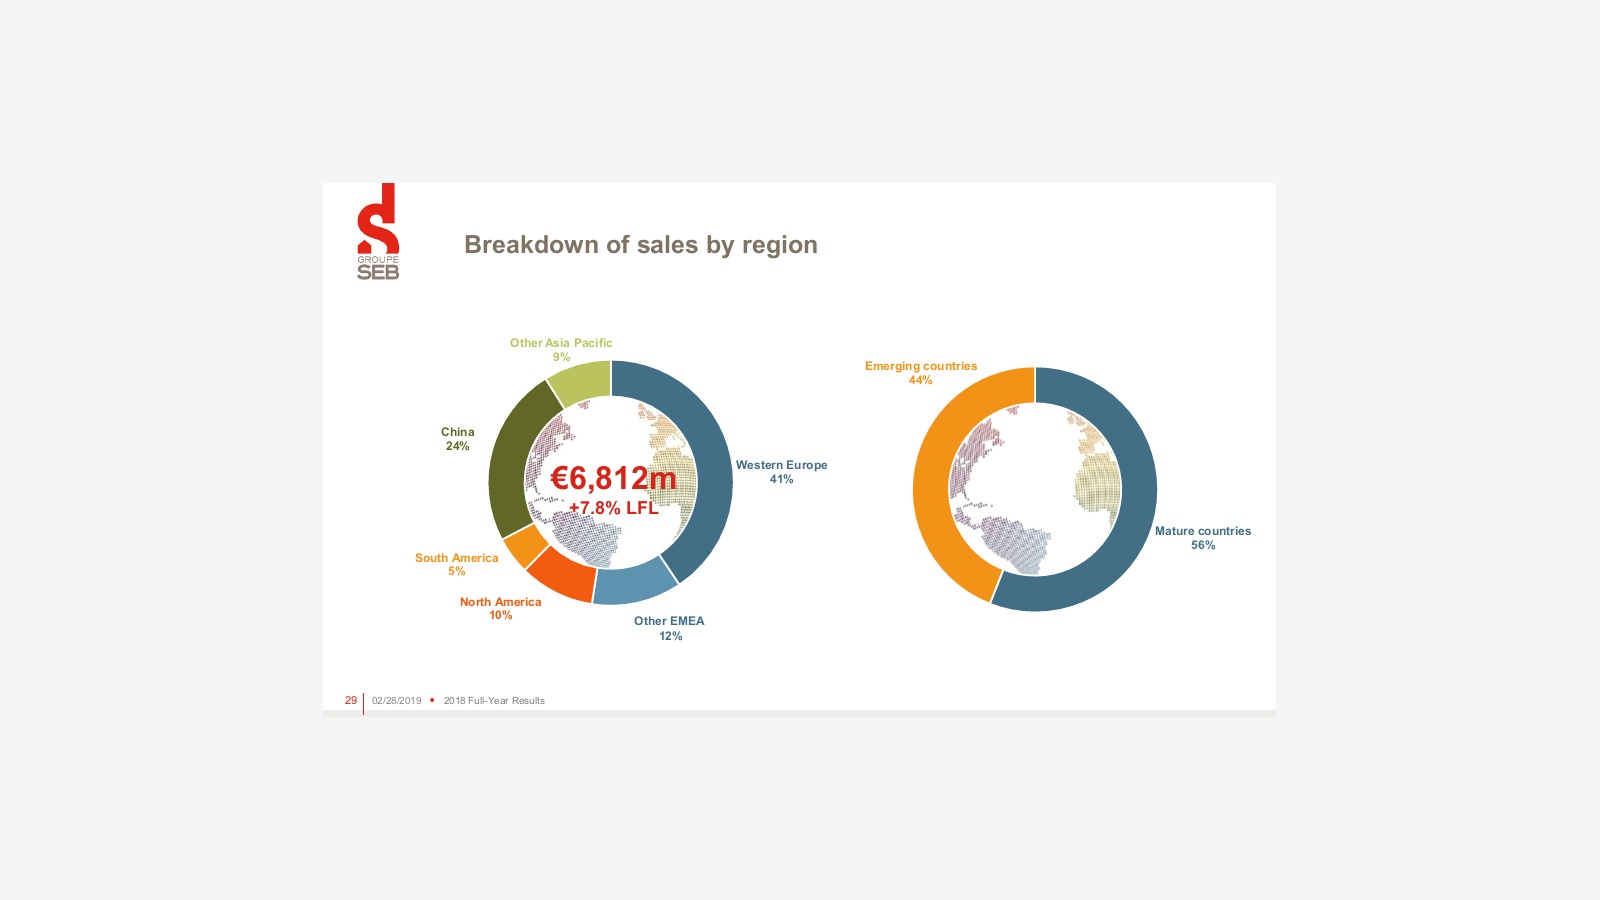
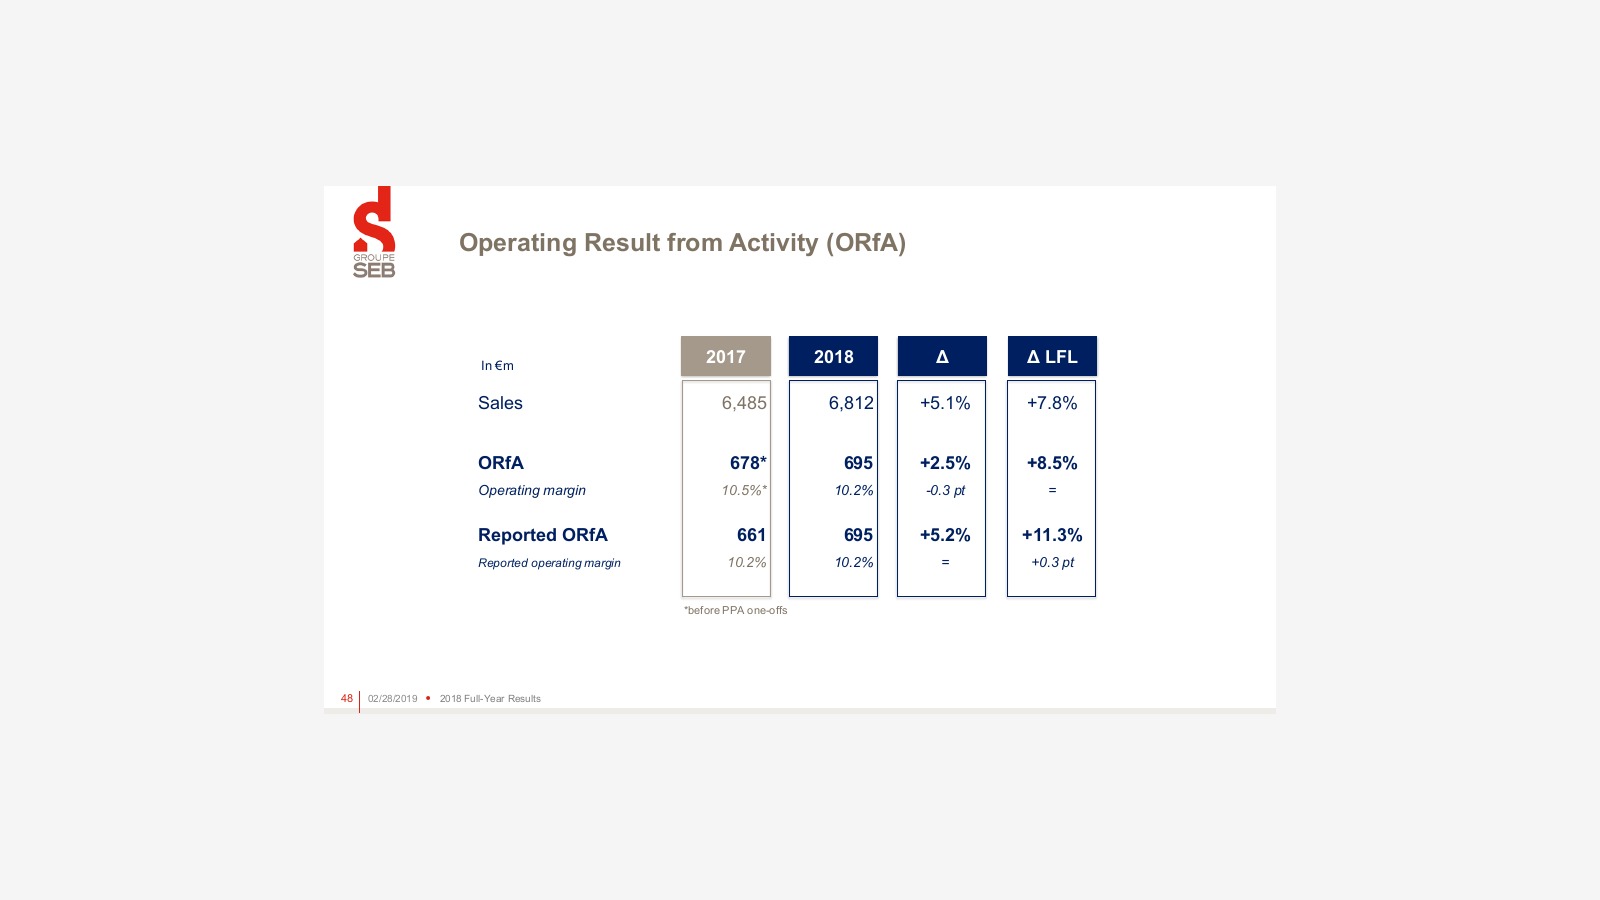
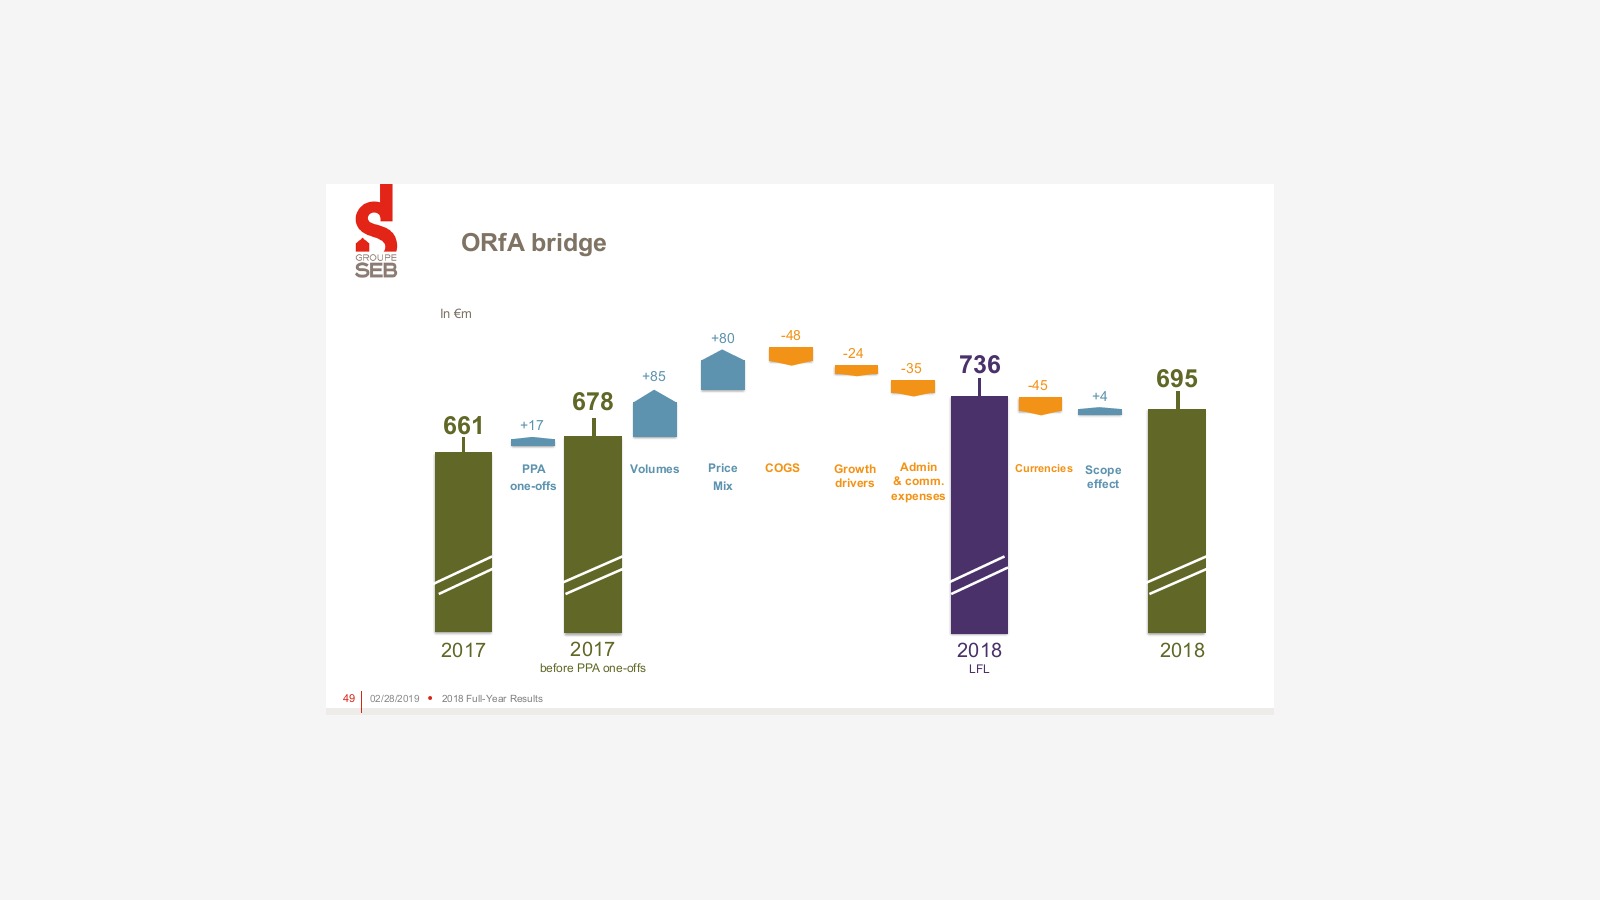
Some changes in sales performance from 2017 to 2018, with sales growing from 6.485 billion euros in 2017 to 6.812 billion euros, representing a natural growth of 7.8%, a currency loss of 3.2%, and other growth of 0.5%.
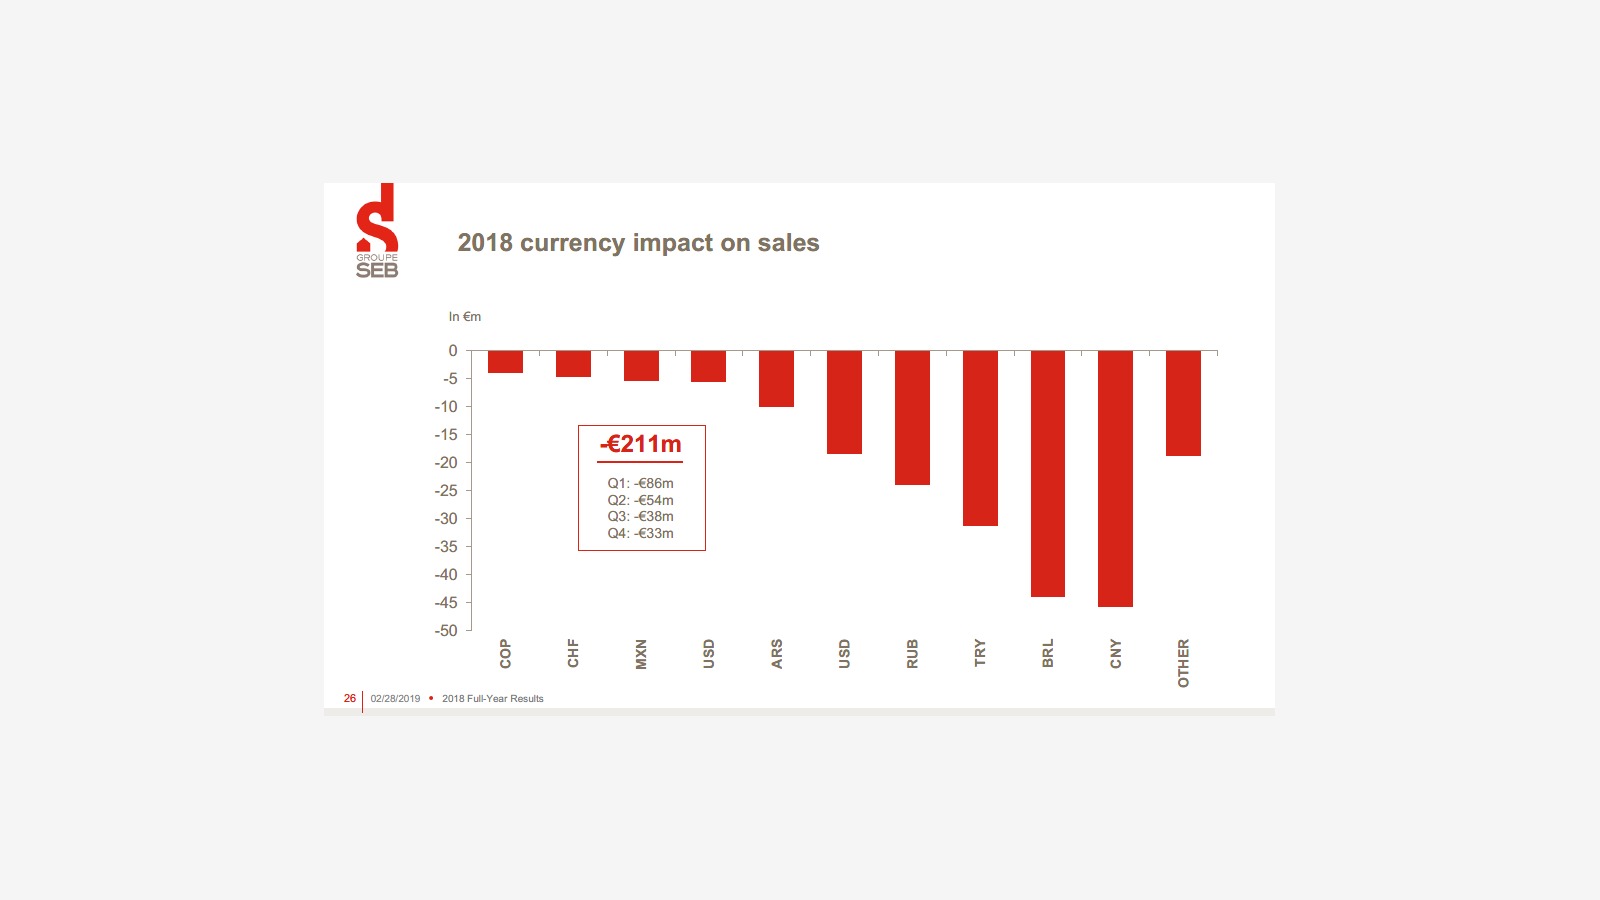
The impact of currency exchange rates on sales in 2018 resulted in a total loss of 211 million euros.
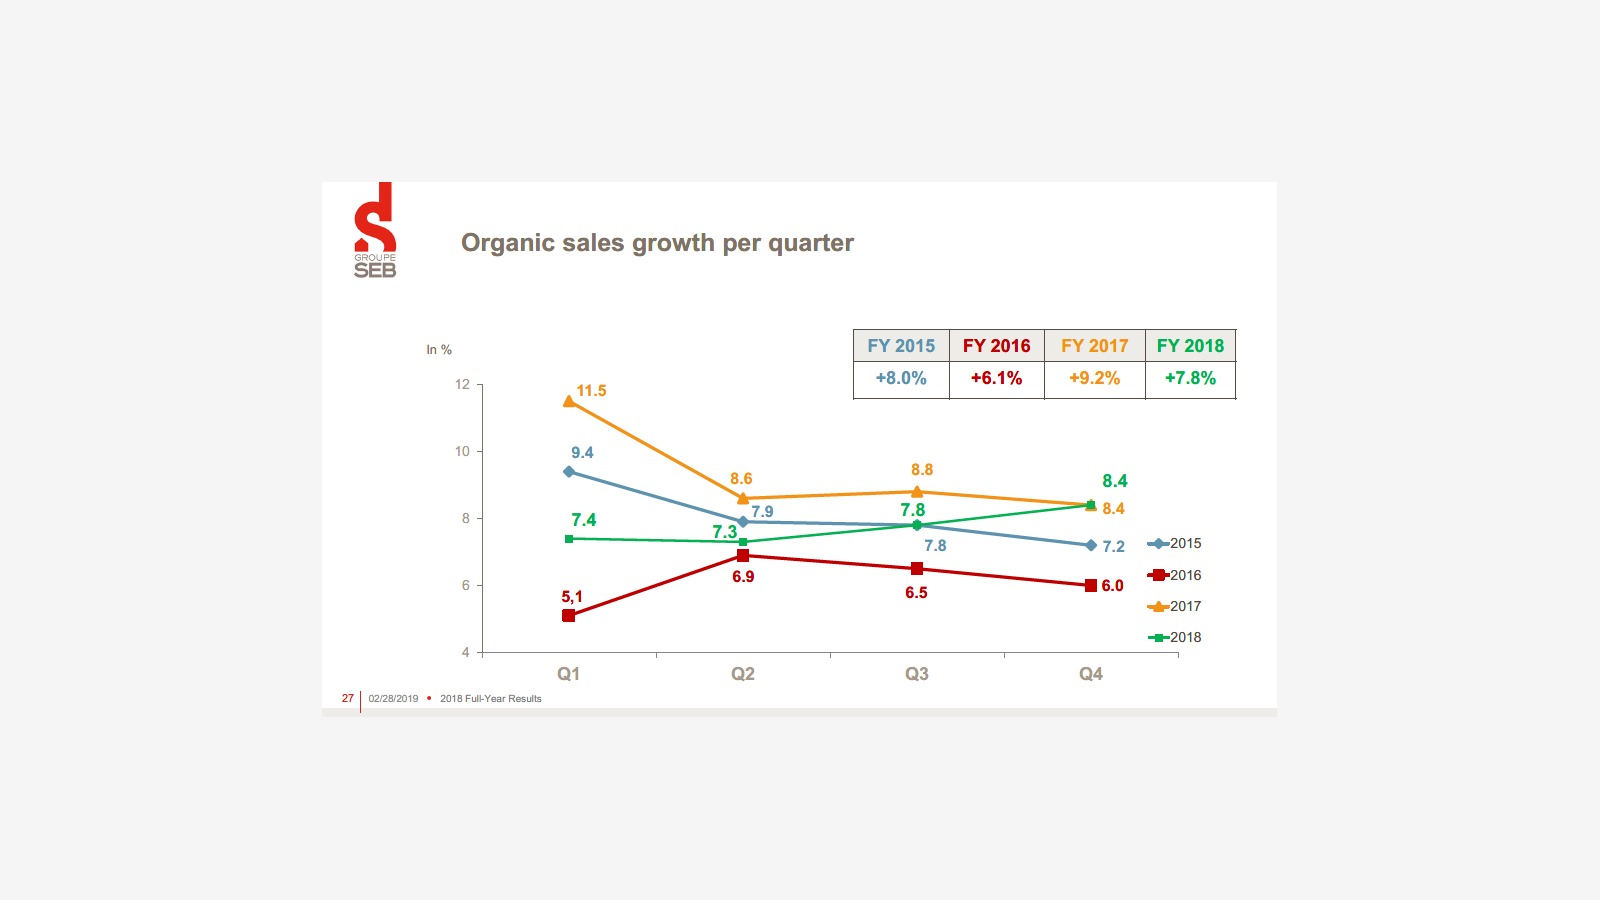
Quarterly Natural Growth Rate
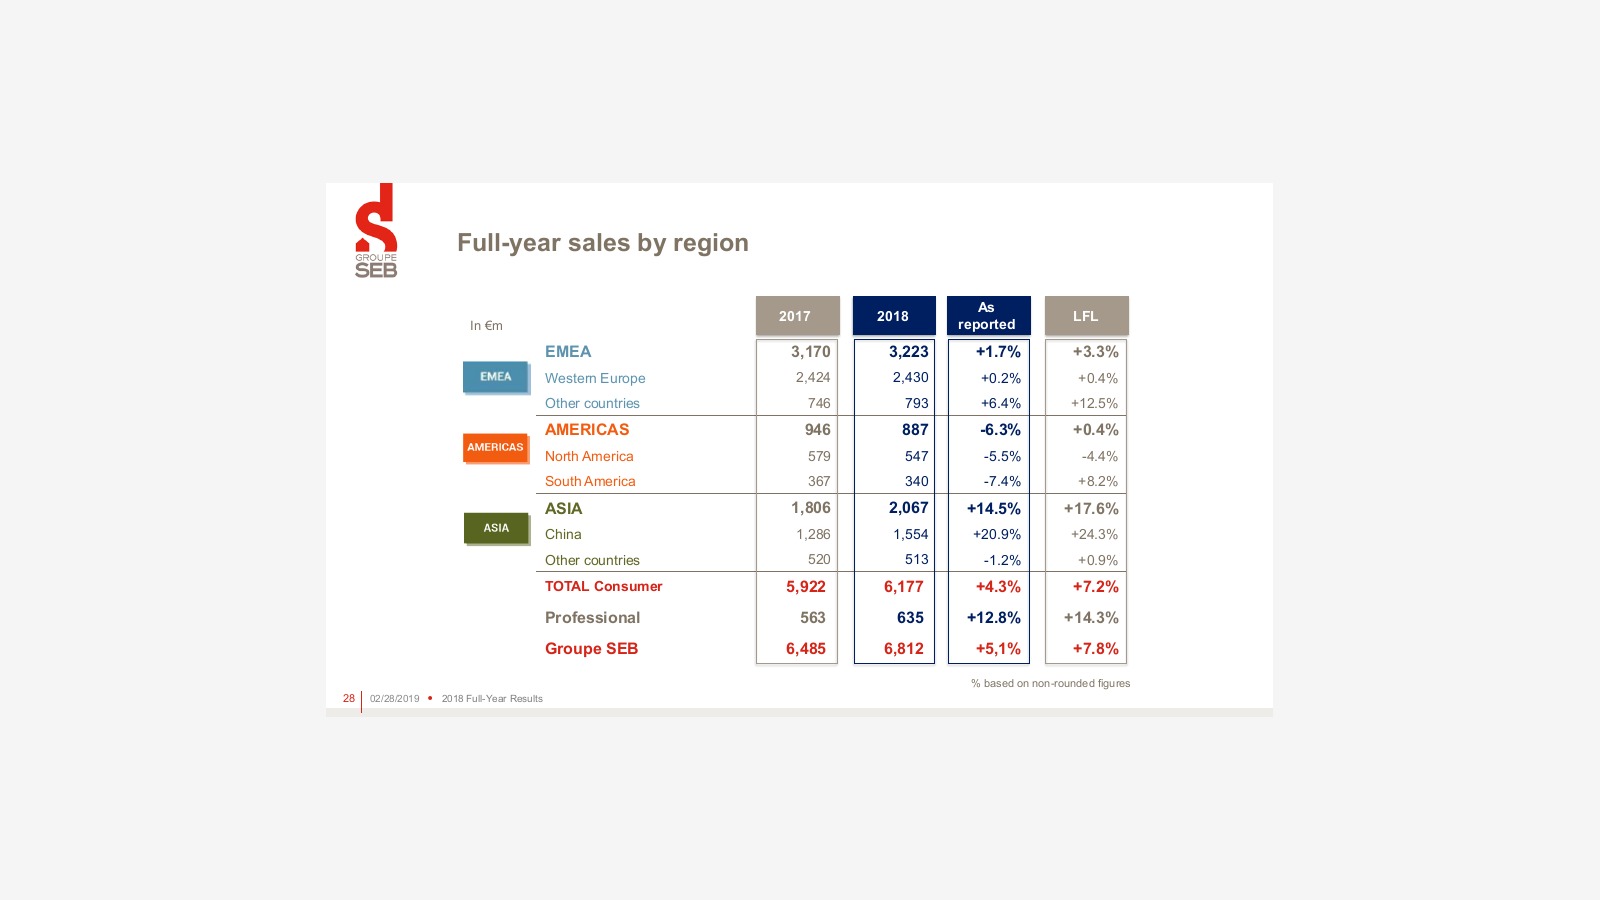
Breakdown of Sales by Region
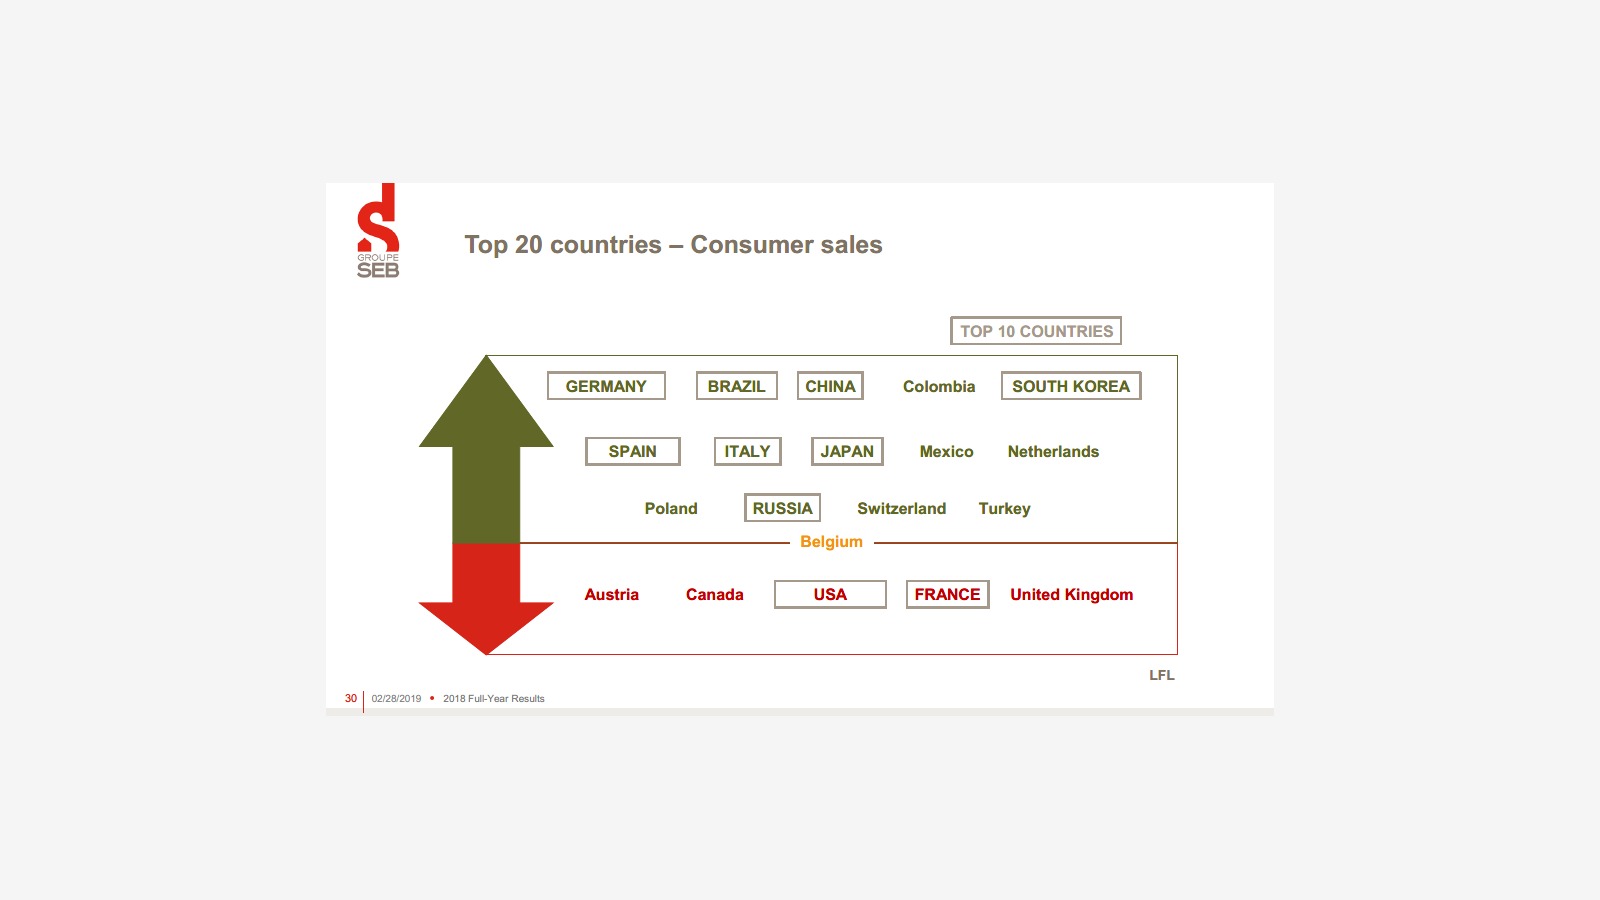
Top 20 Countries by Sales Revenue
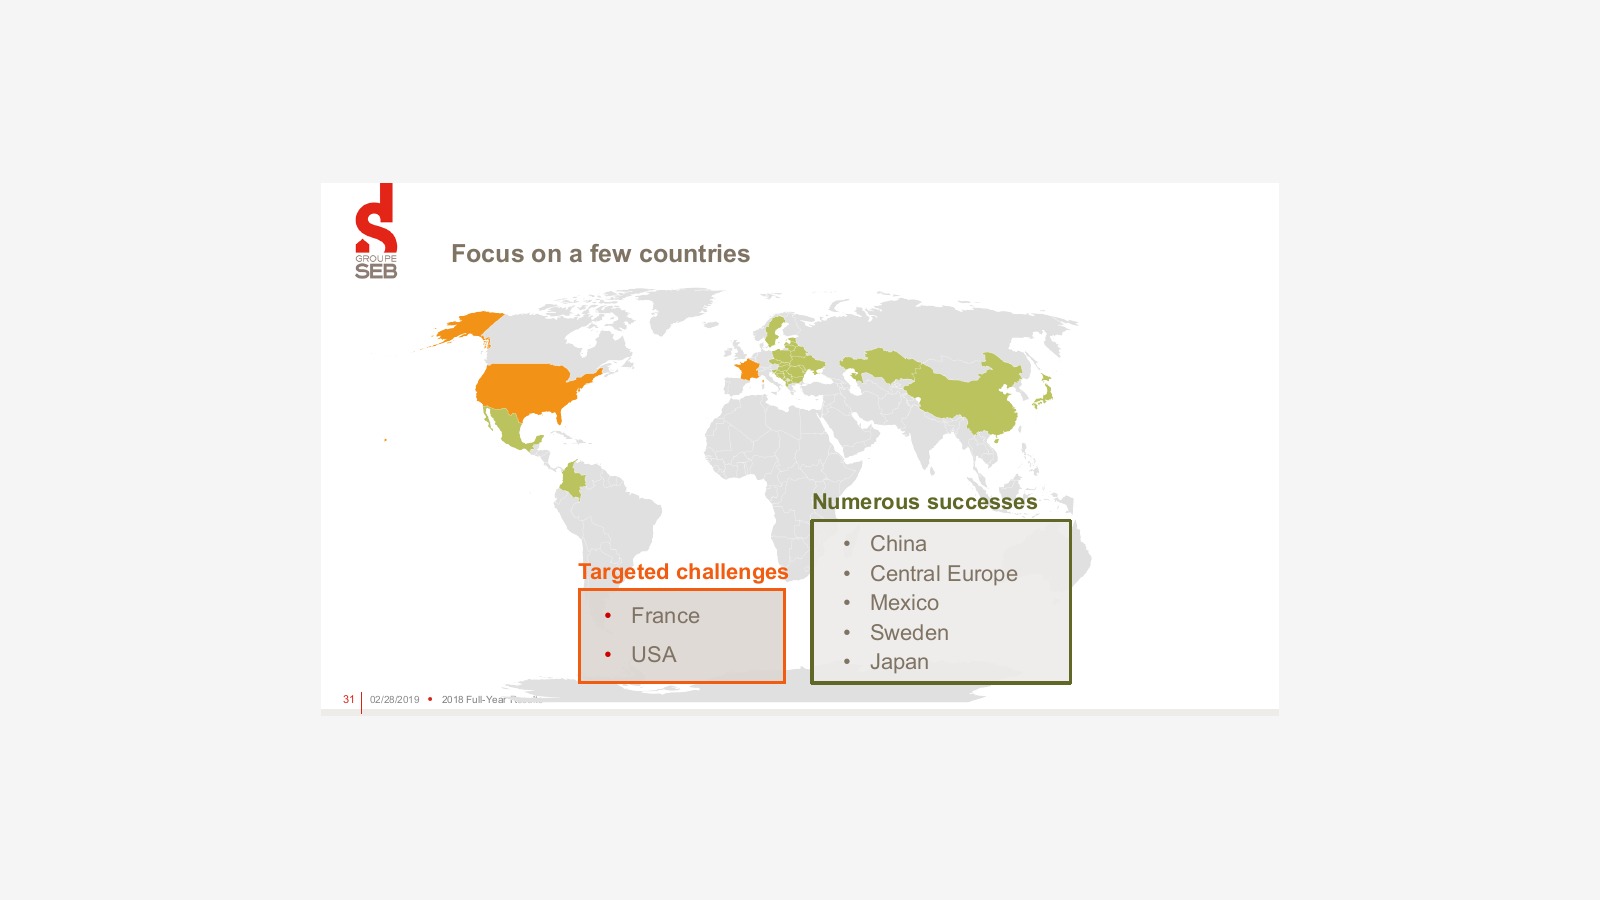
Key Markets:
Challenging Markets: France, United States
Performing Well: China, Central Europe, Mexico, Sweden, Japan
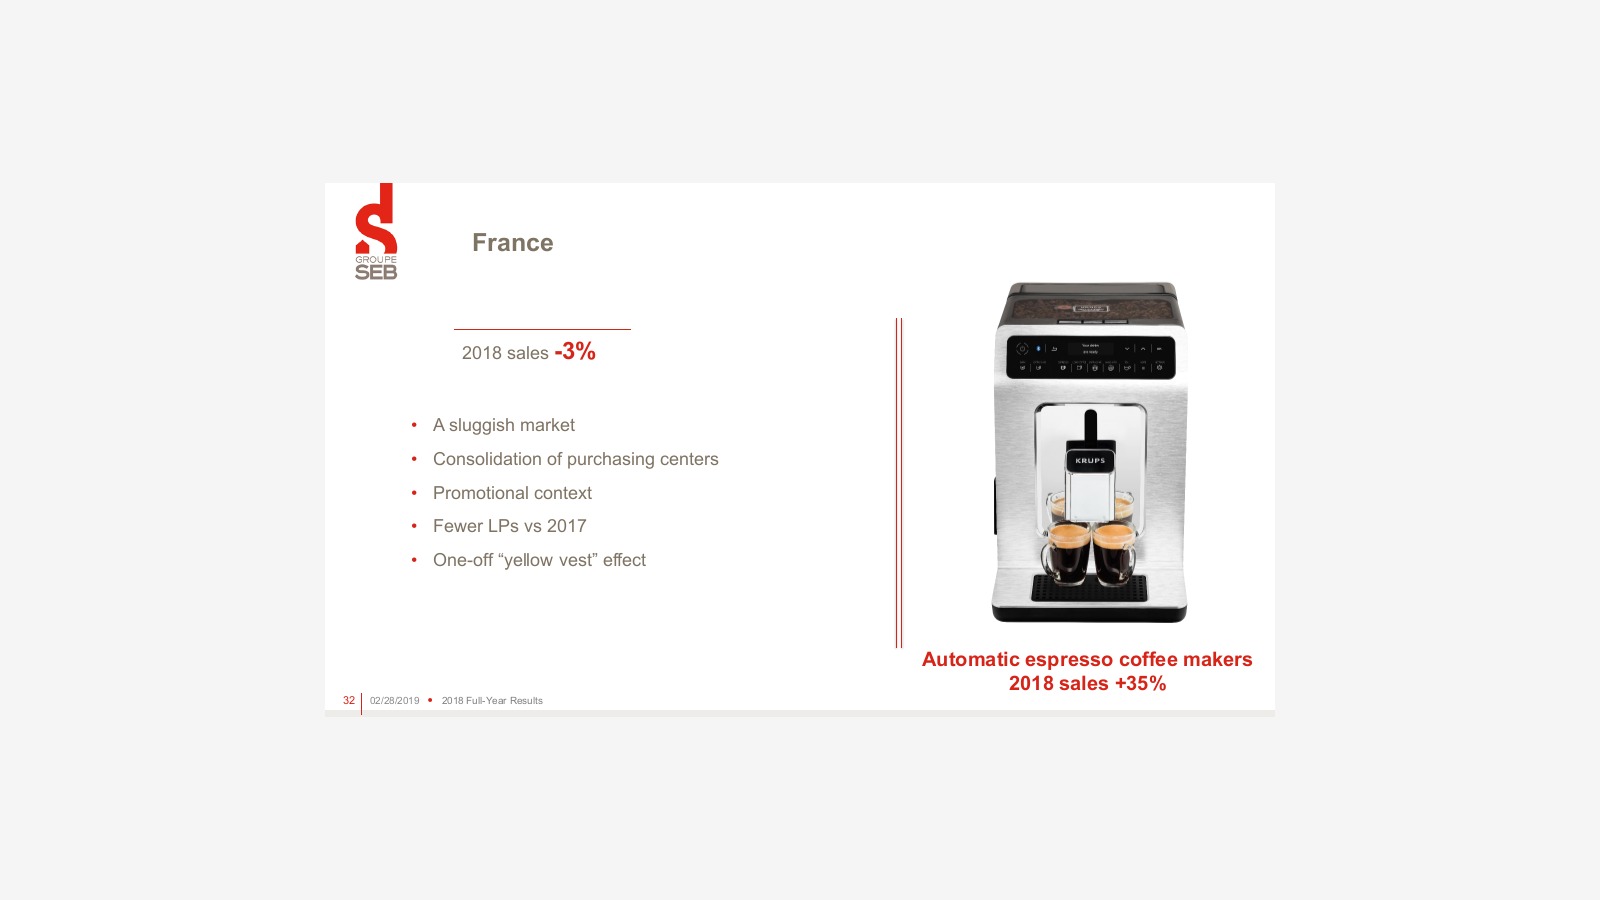
Sales in the French Market Decreased by 3% in 2018 (Automatic Coffee Machines Grew by 35%):
Market Downturn
Procurement Center Integration
Complex Environment
Yellow Vest Protests Marketing
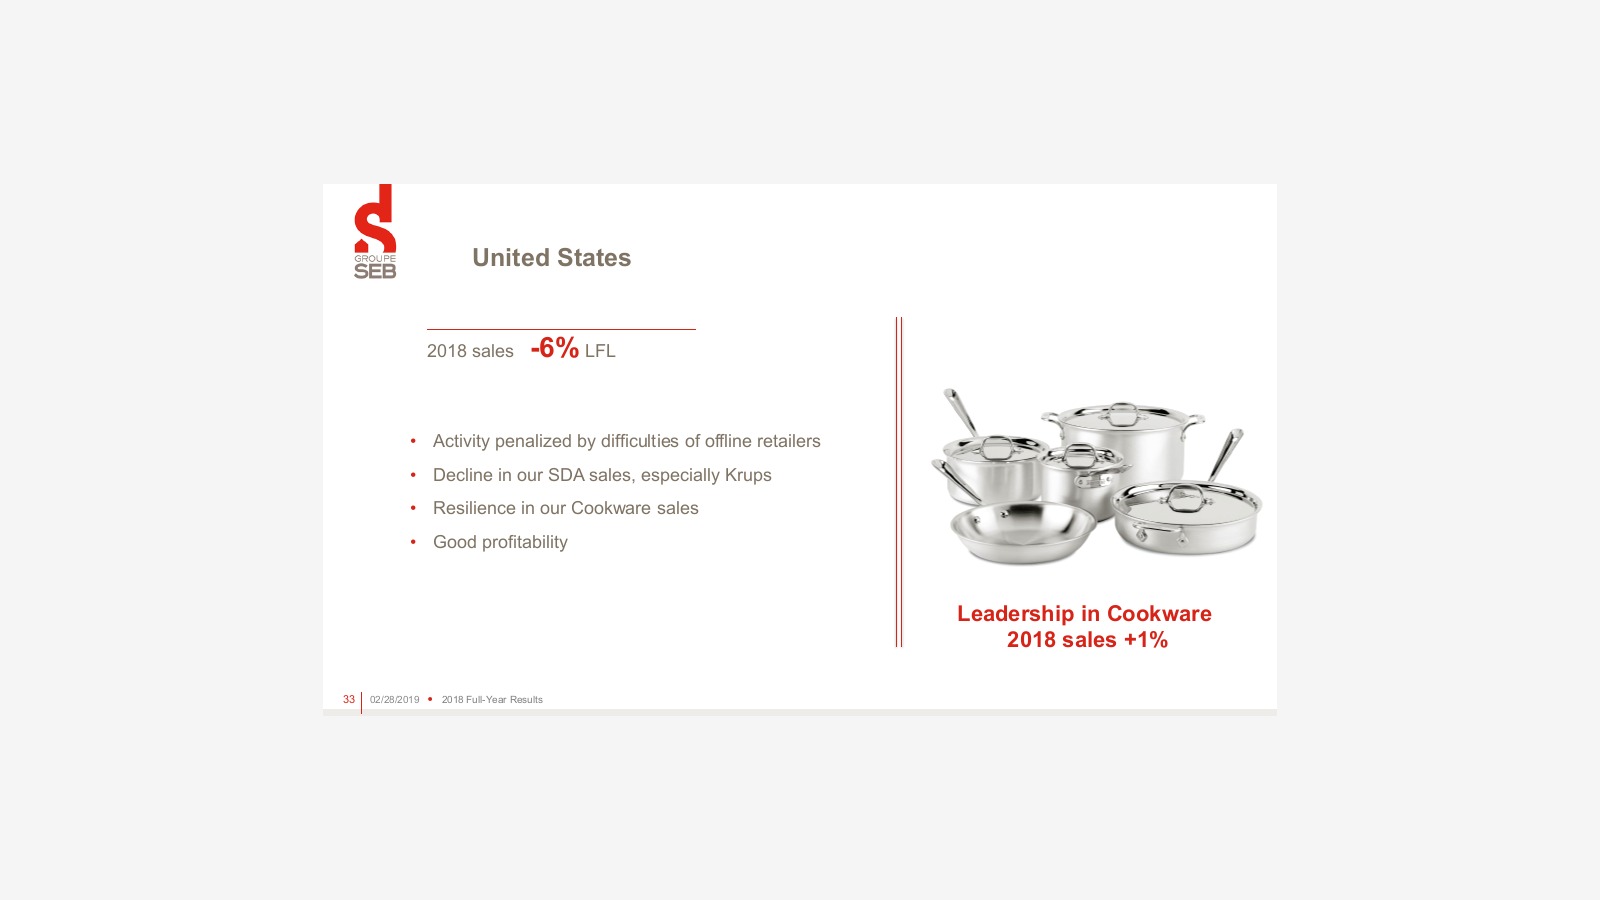
Sales in the United States decreased by 6% in 2018 (with kitchen appliances continuing to lead with a 1% sales increase):
Decline in small appliance business driven by challenges for offline retailers
Recovery of kitchen products, particularly from Krups
Good profit margins
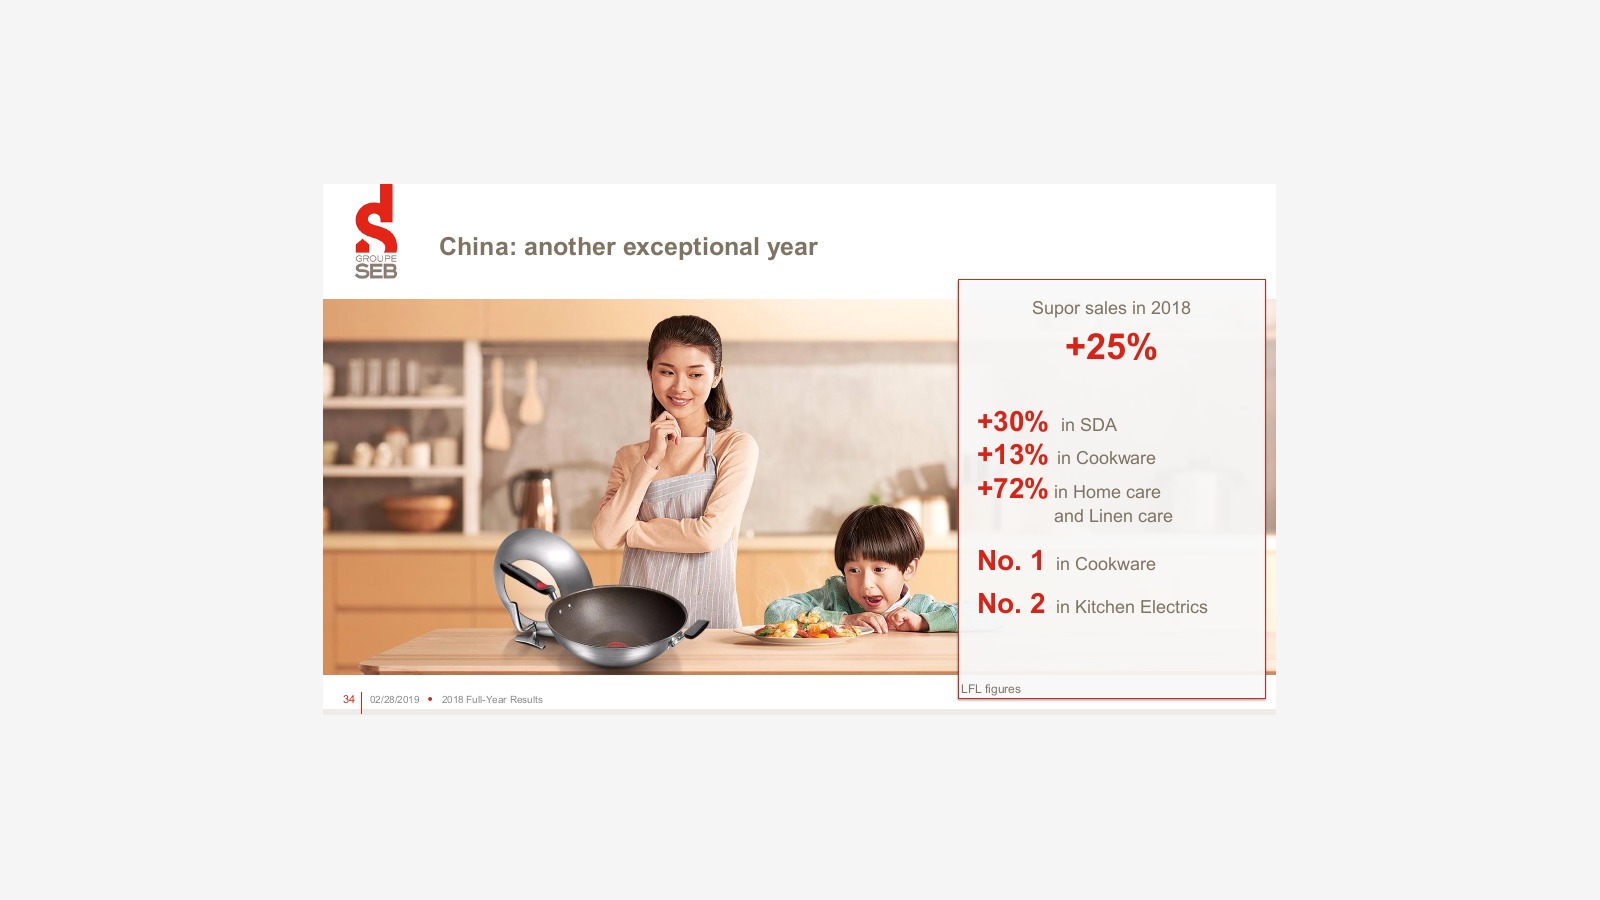
Chinese Market: An Unexpected Year, Supor's Overall Sales Increased by 25% (Supor Friends Should Be Getting More Bonuses)
SDA grew by 30%.
Cookware increased by 13%.
Home care and linen care saw a growth of 72%.
Cookware ranked first.
Kitchen appliances ranked second.
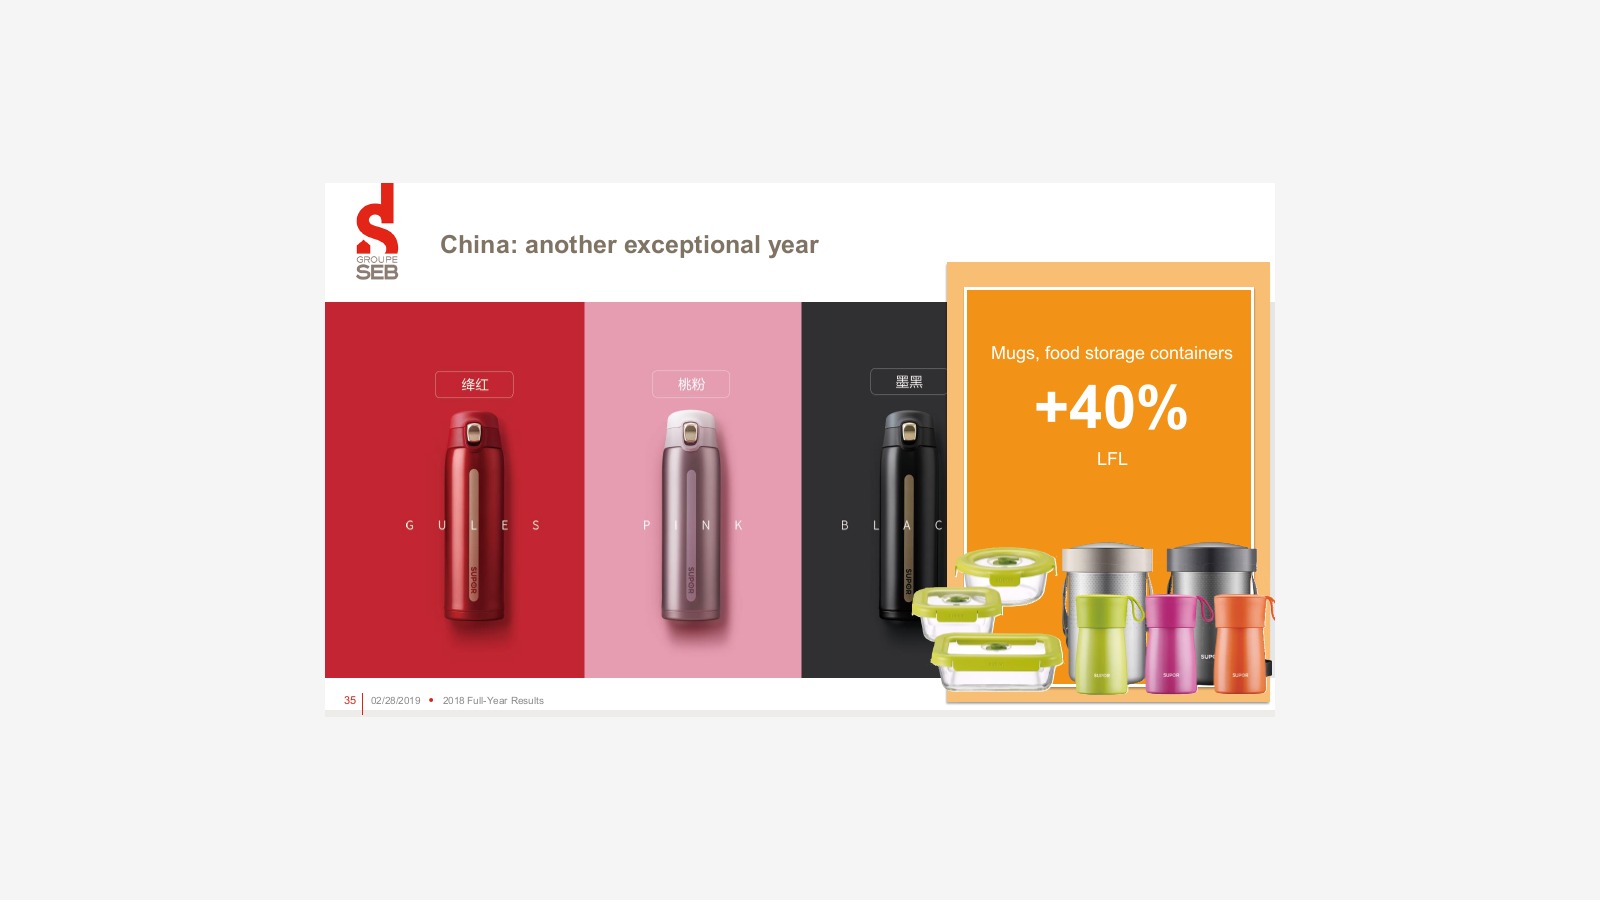
Insulated cups, storage bottles, and similar items grew by 40%
Central and Eastern Europe, Eastern Europe: Accelerated Growth, 2018 Growth Rate 21%.
Poland: 30% Growth
Ukraine: 53% Growth
Slovenia: 26% Growth
Romania: 37% Growth
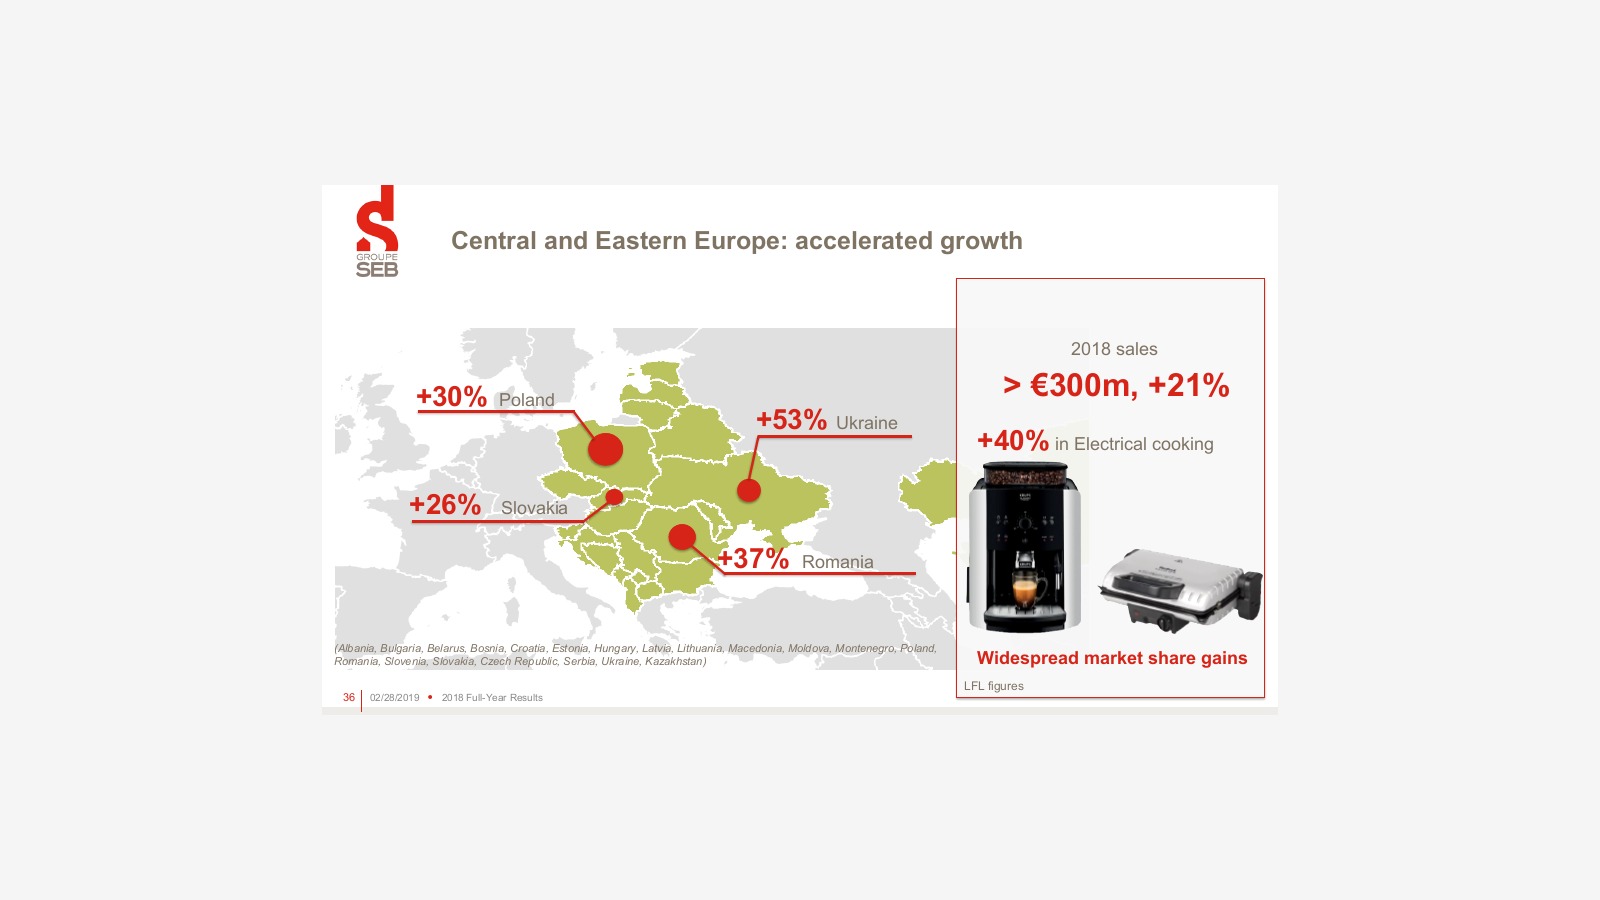
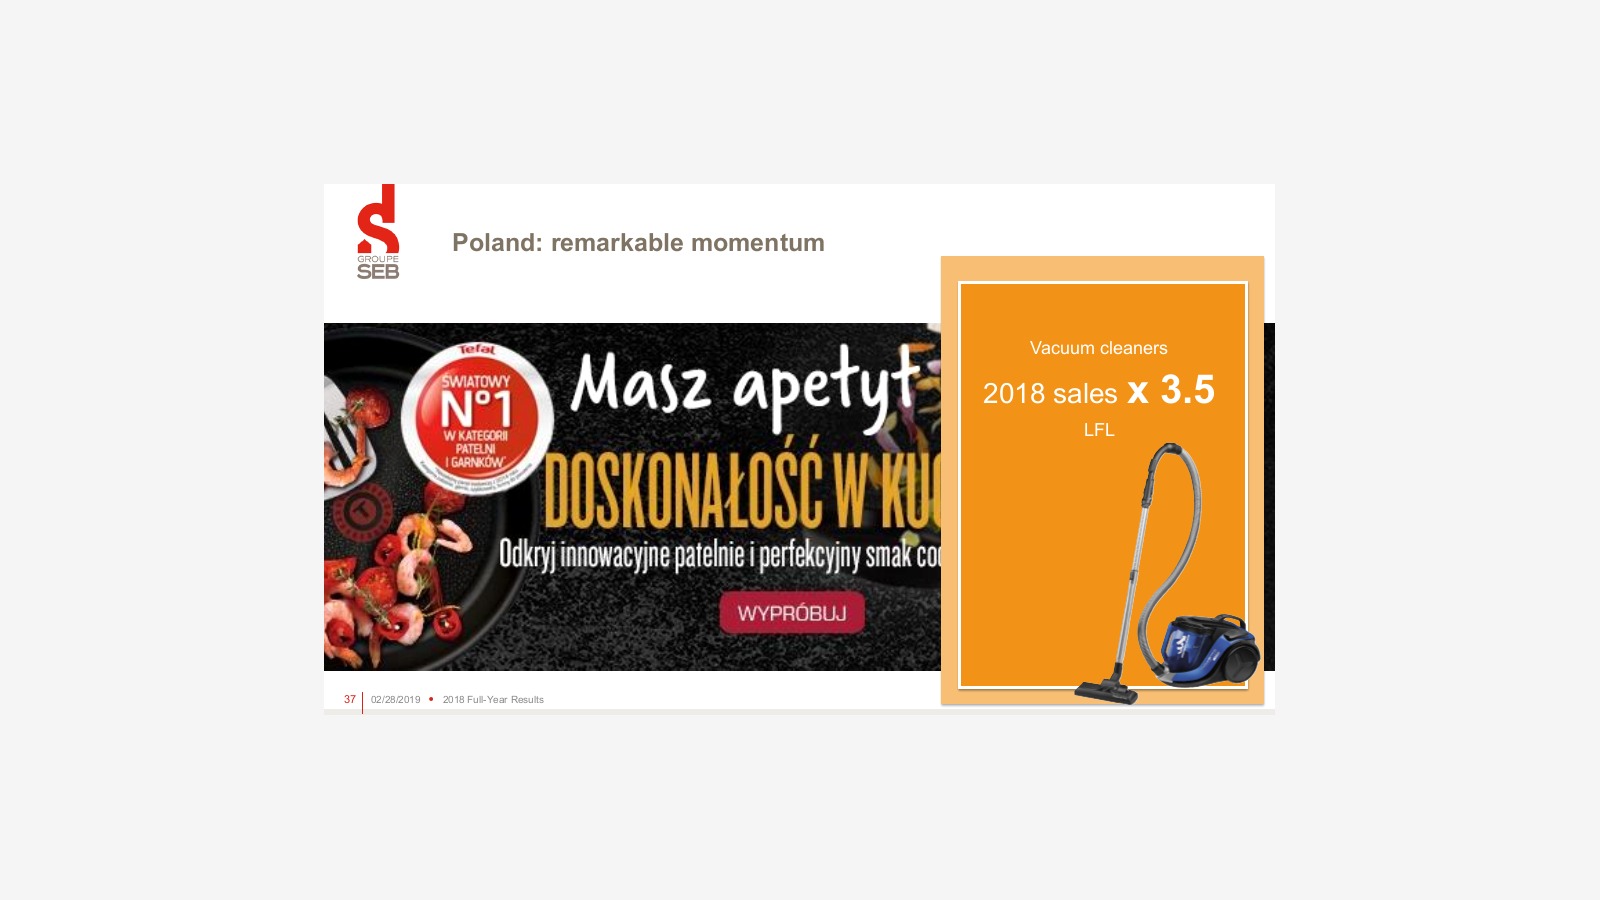
Polish Market Vacuum Cleaner Sales Tripled by 3.5 Times
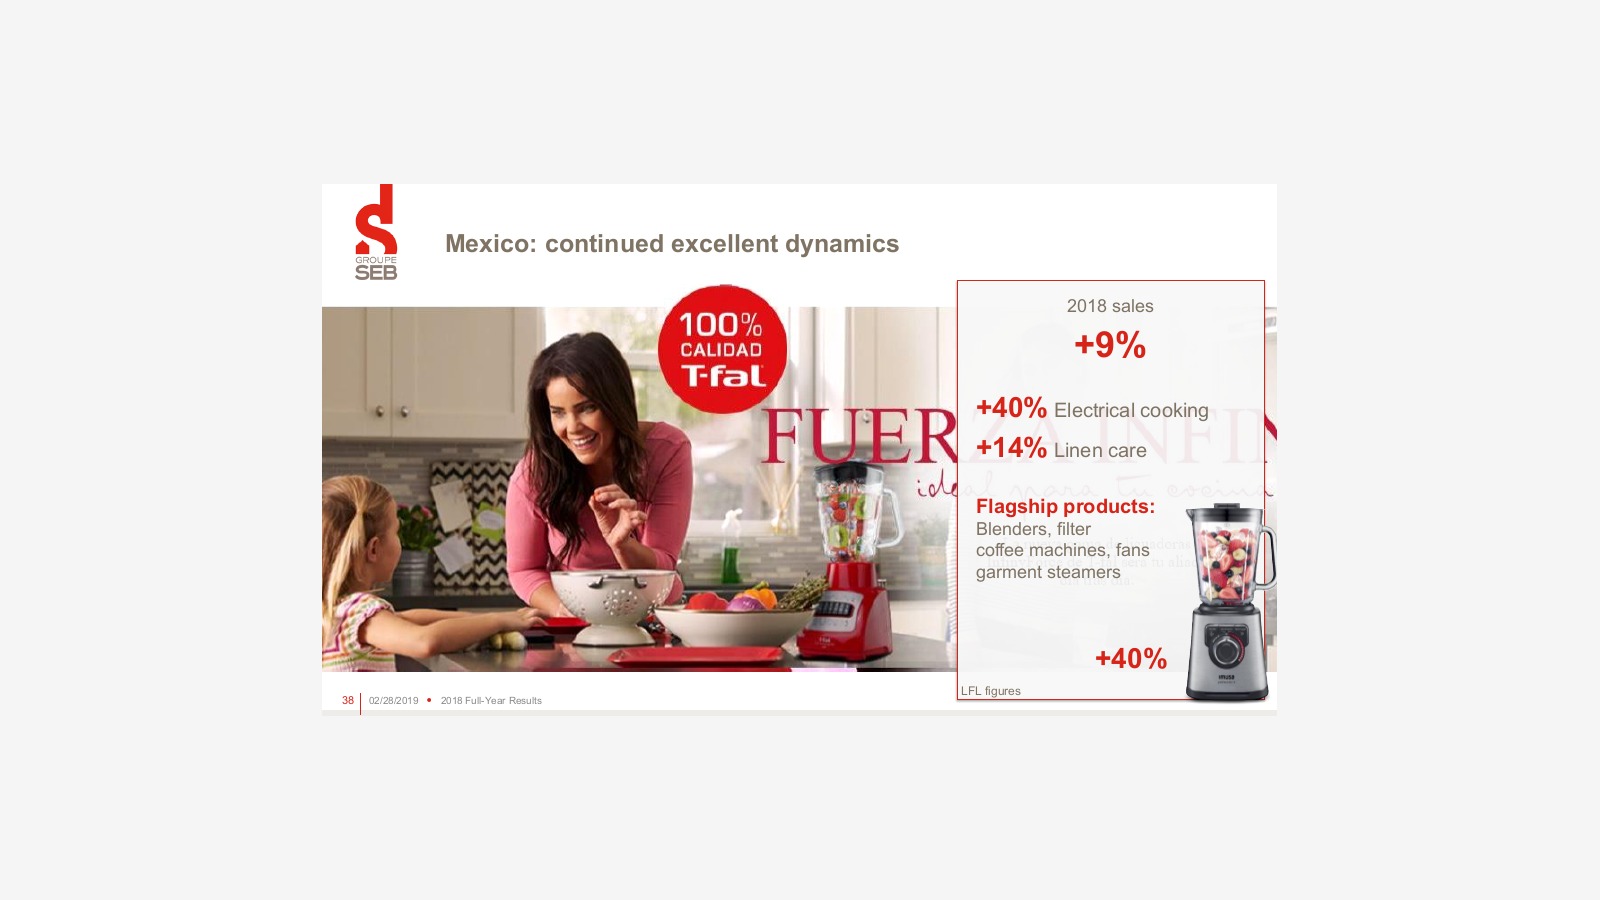
Mexico: 9% growth in 2018, electric cookware up 40%, Linen care up 14%
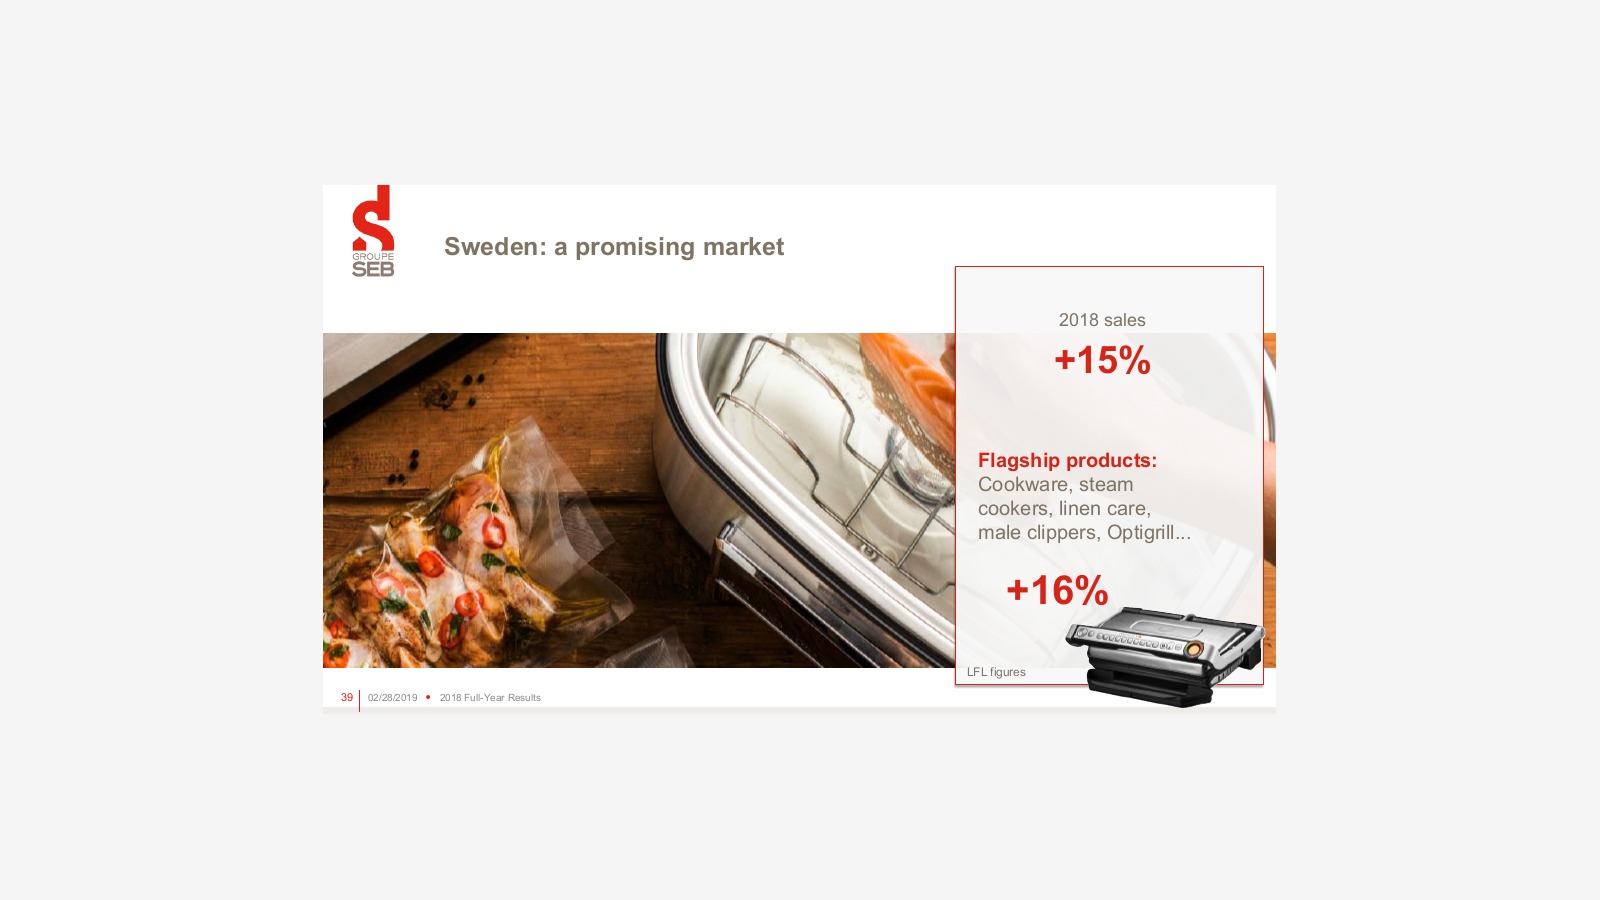
Sales in the Swedish market increased by 15%, with flagship products growing by 16%.
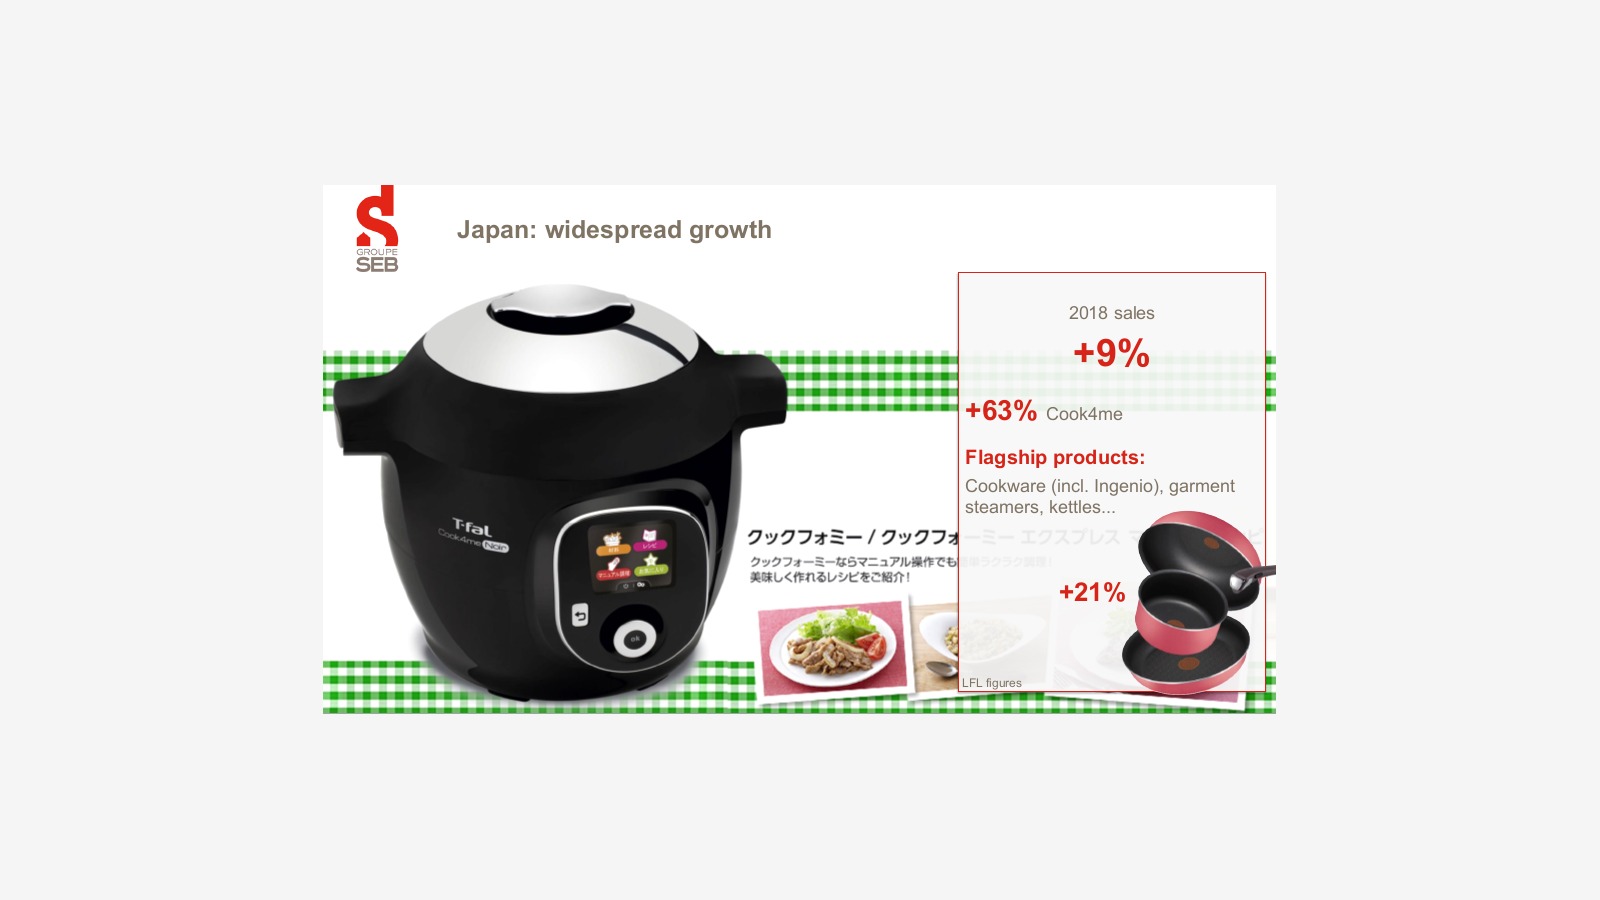
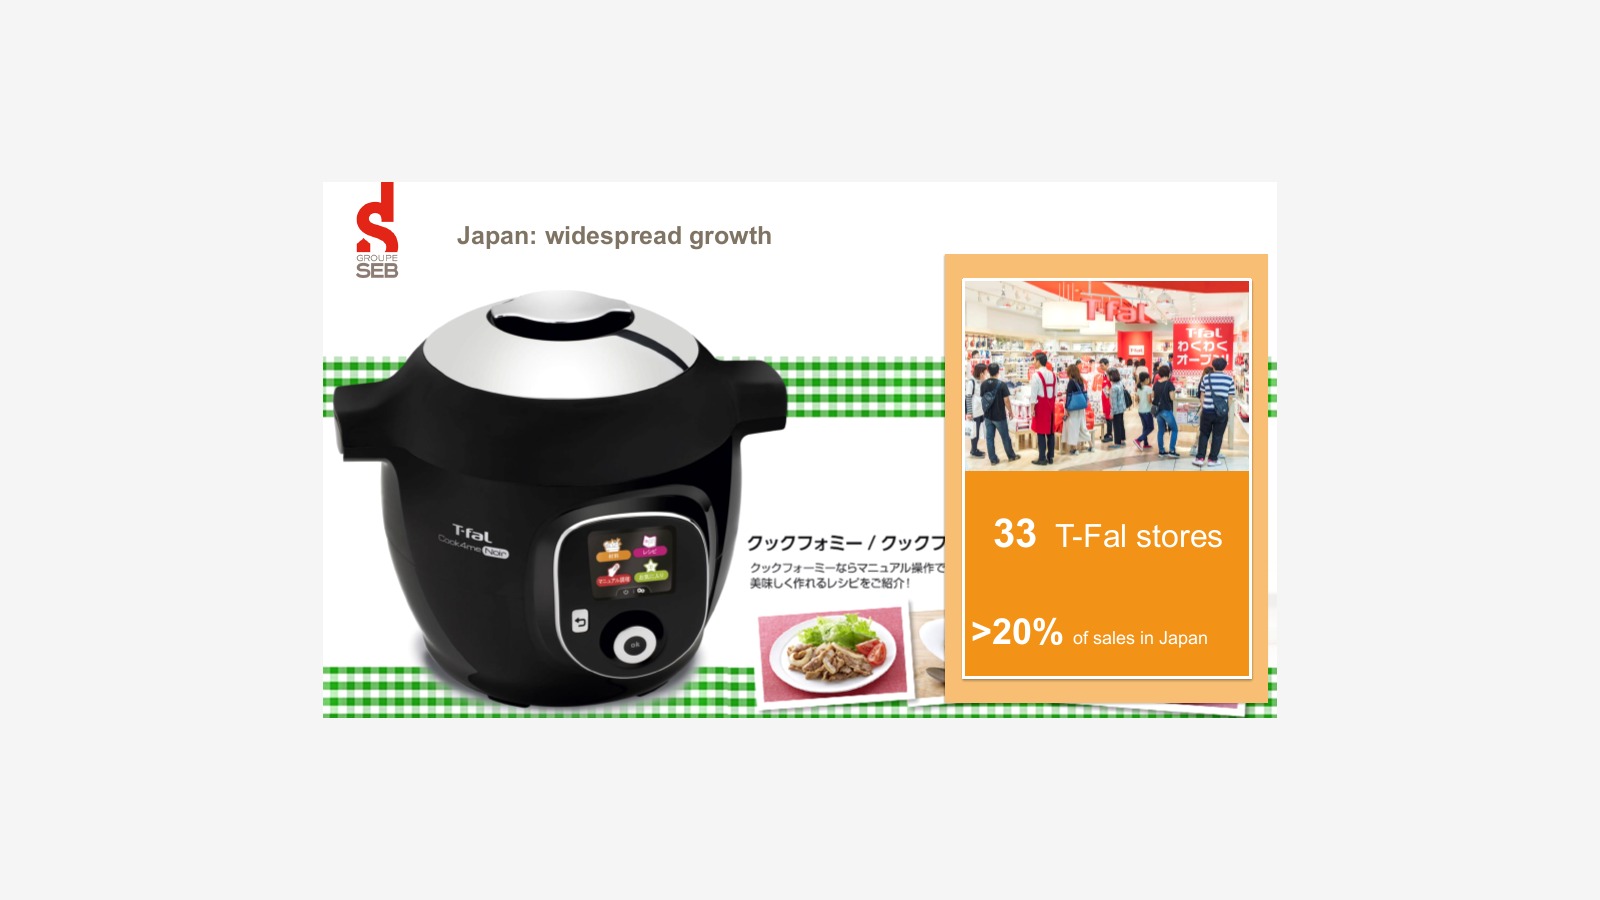
Sales in the Japanese market grew by 9%, with Cook4me increasing by 63%. Flagship products grew by 21%.
s
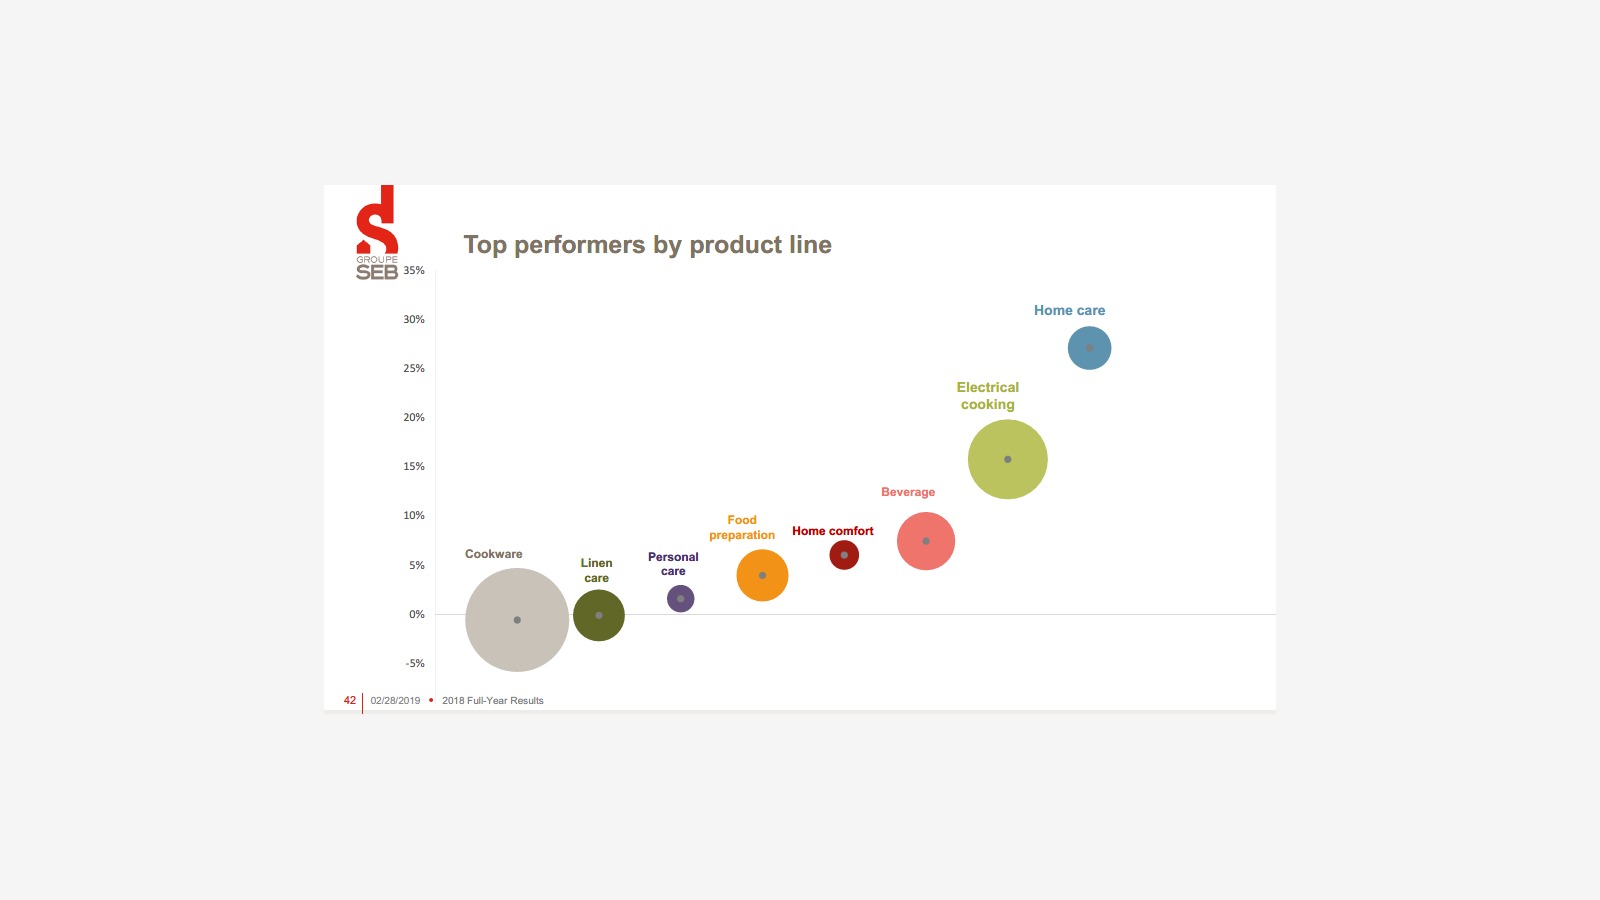
Growth Ratios for Various Product Lines
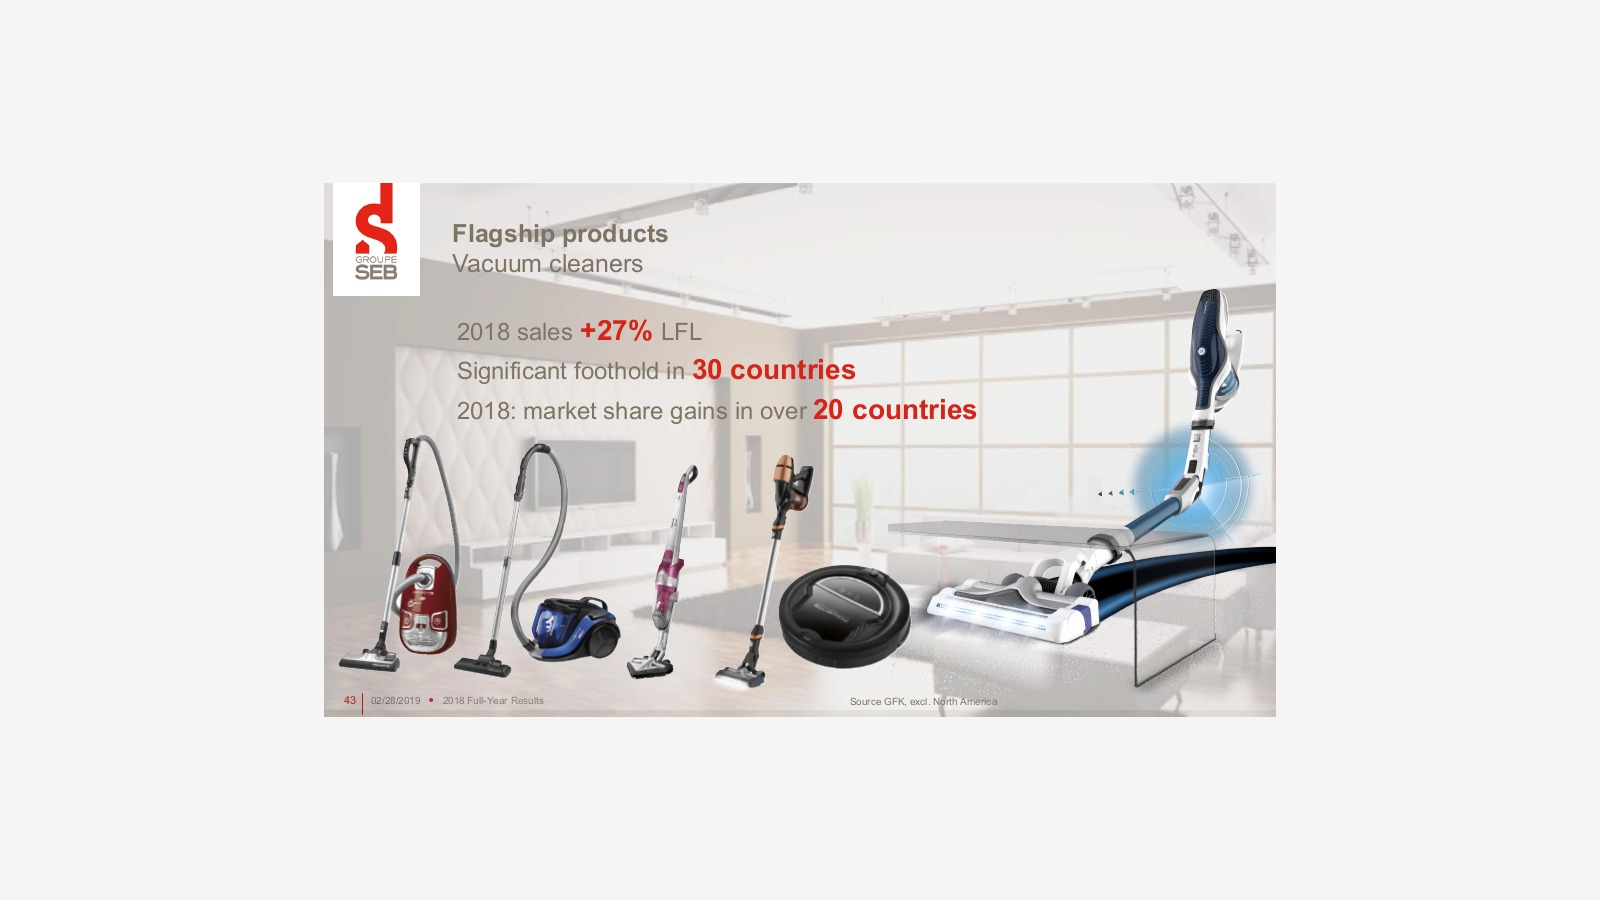
Flagship Product: Vacuum Cleaner Growth of 27%, Winning Market Share in 20 Countries
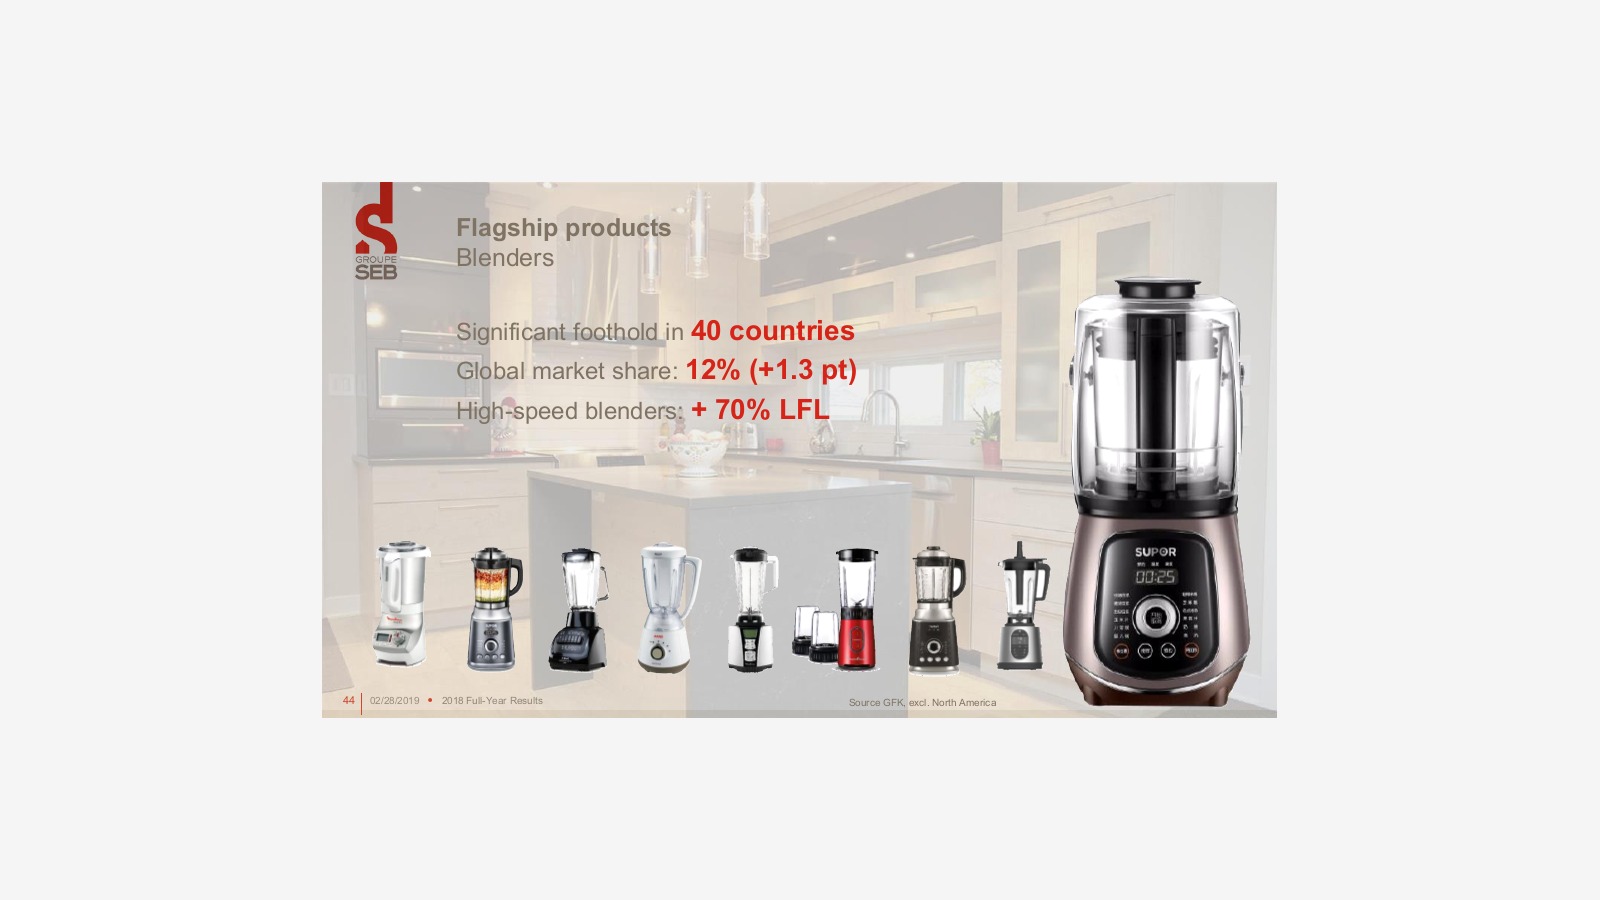
Flagship Product: The global market share for the mixer is 12%, with high-speed mixers growing by 70%.
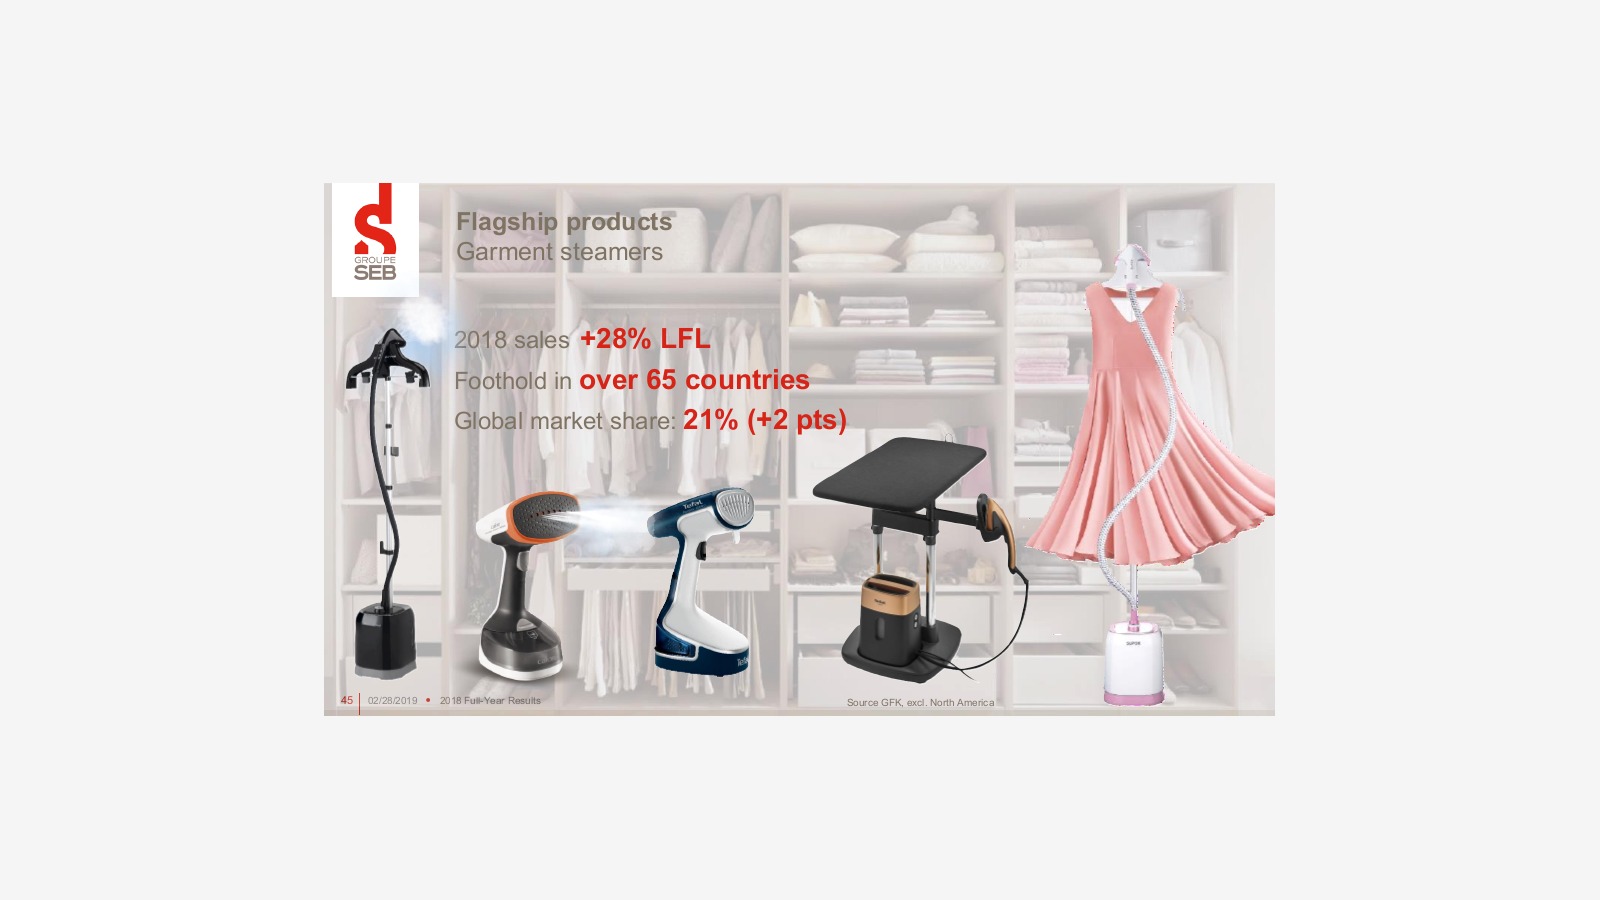
Flagship Product: Steam Iron
Sales grew by 28% in 2018, with a global market share of 21%.
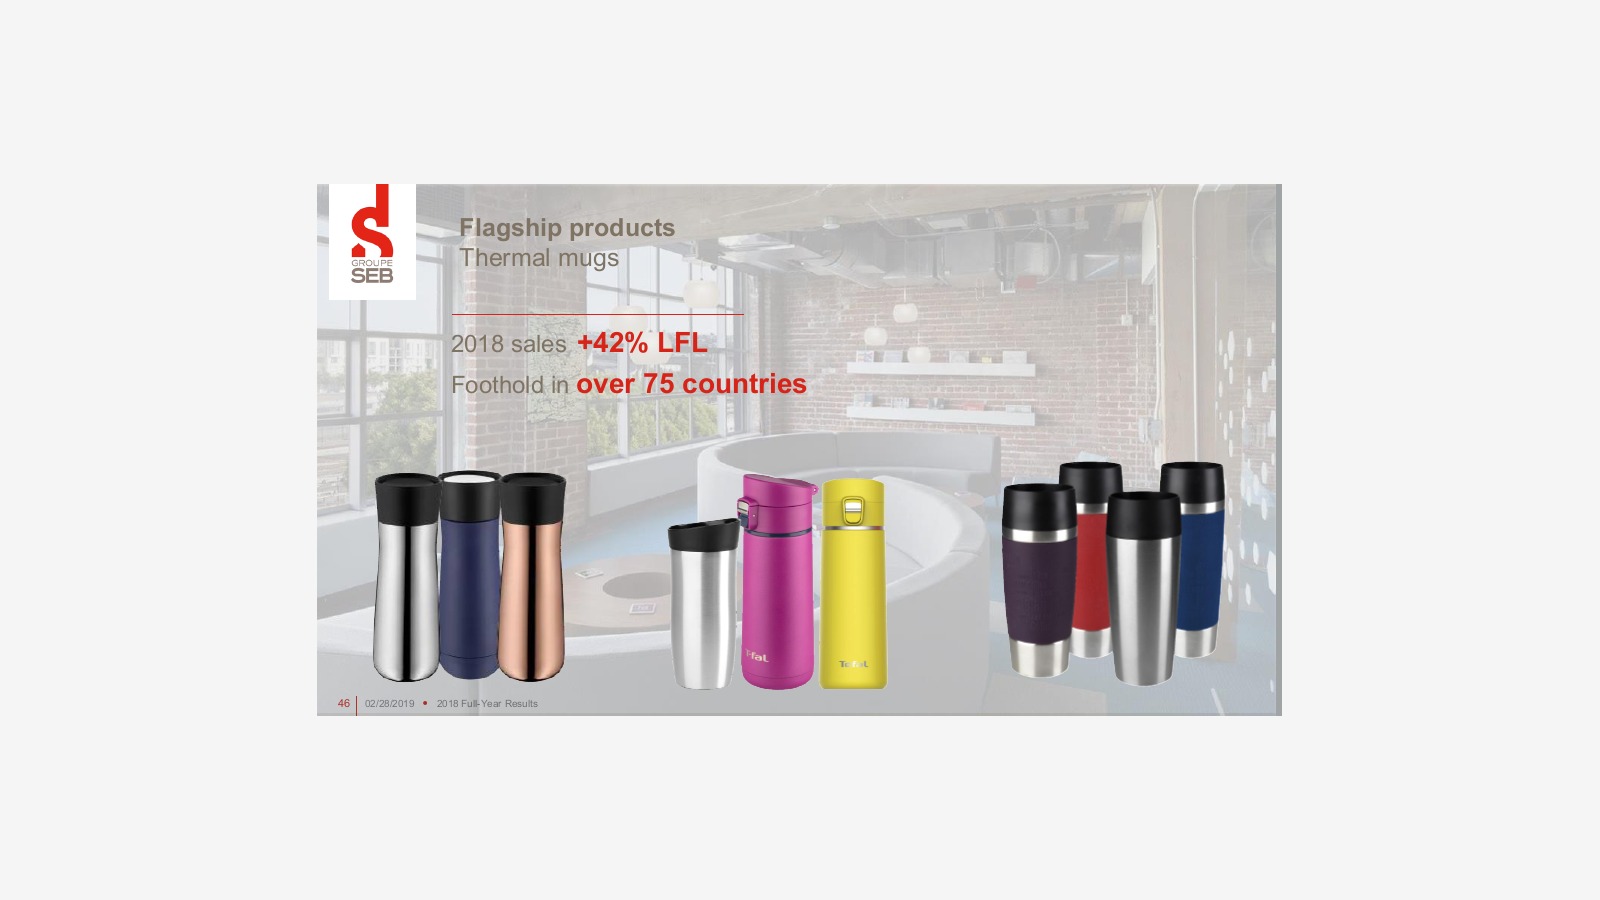
Flagship Product: Insulated Mug, Sales Up 42%
Sales Revenue
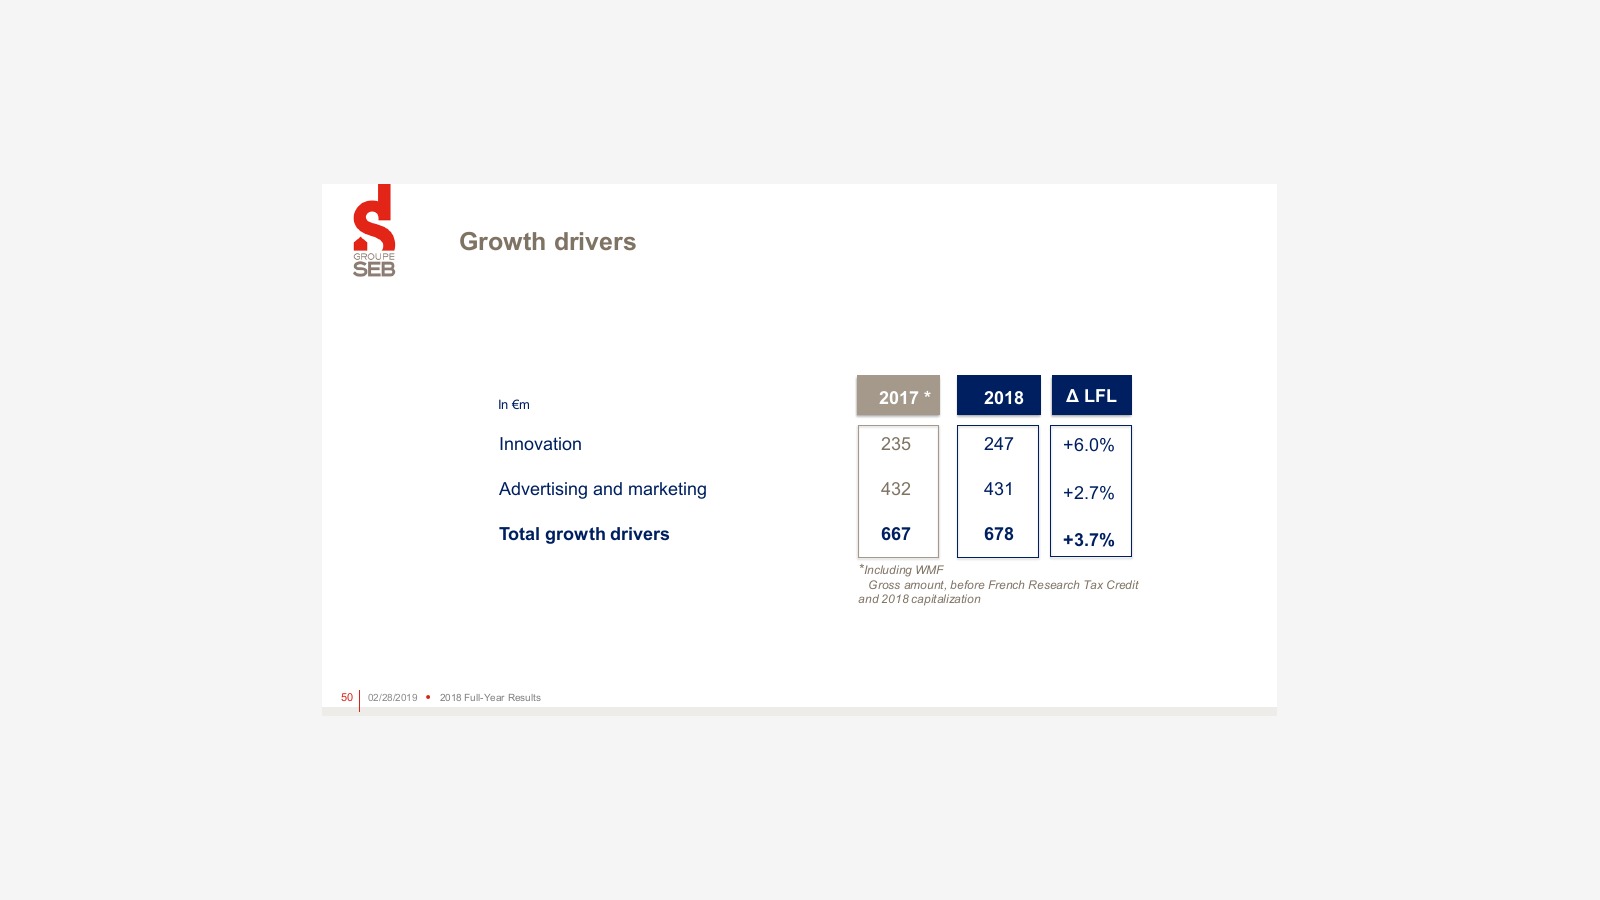
Growth Factors:
Innovation
Advertising and Marketing
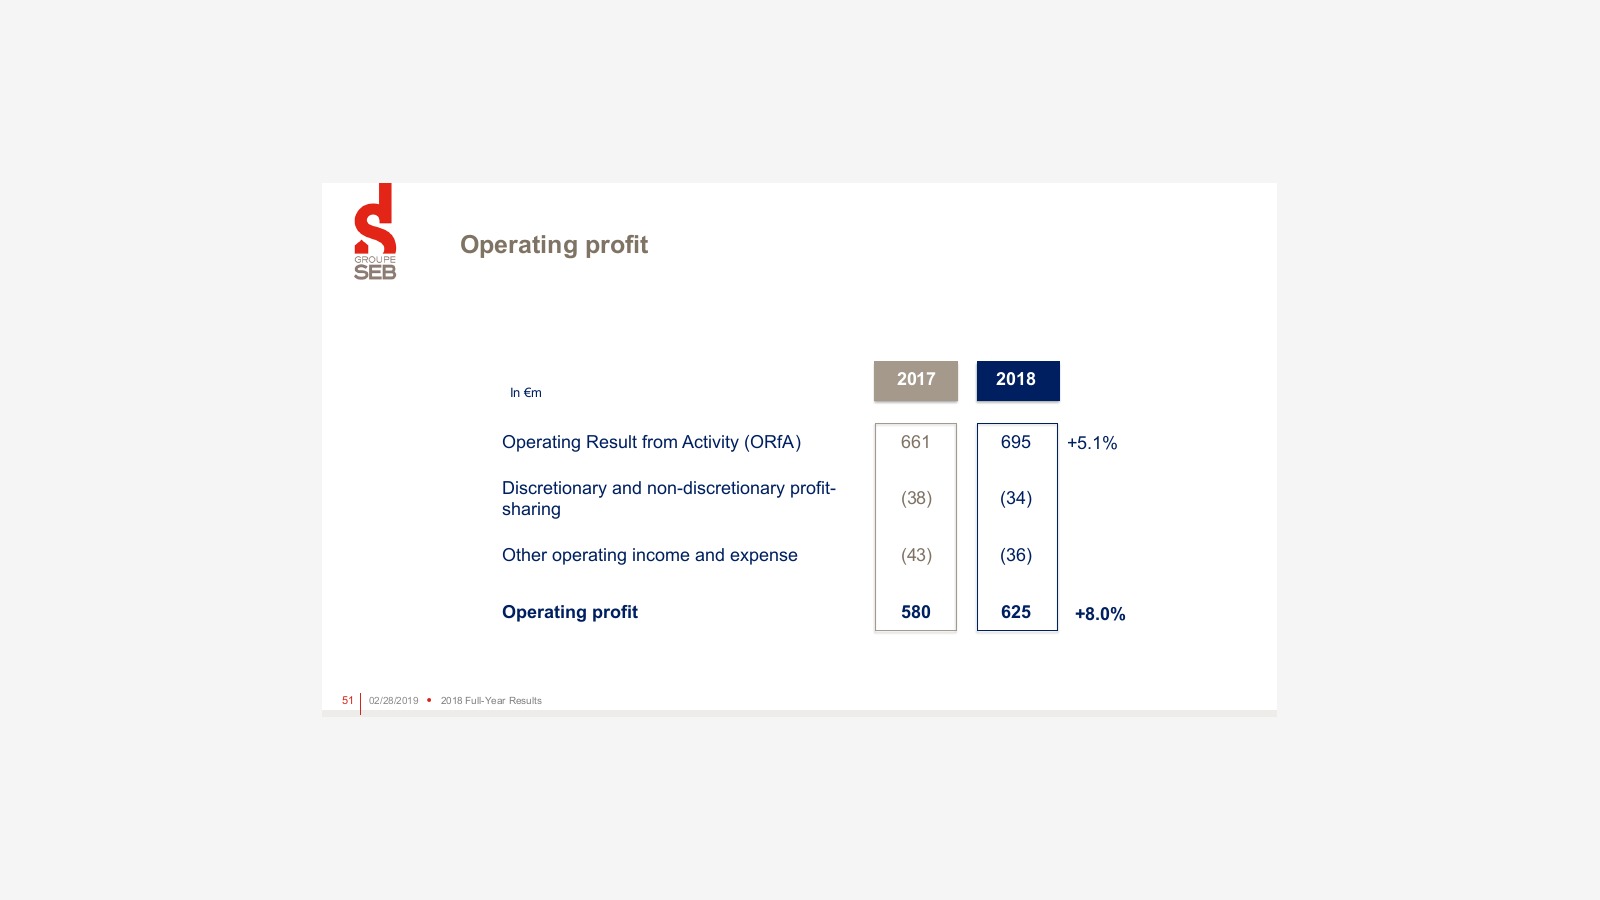
Marketing Profit:
Net Profit:
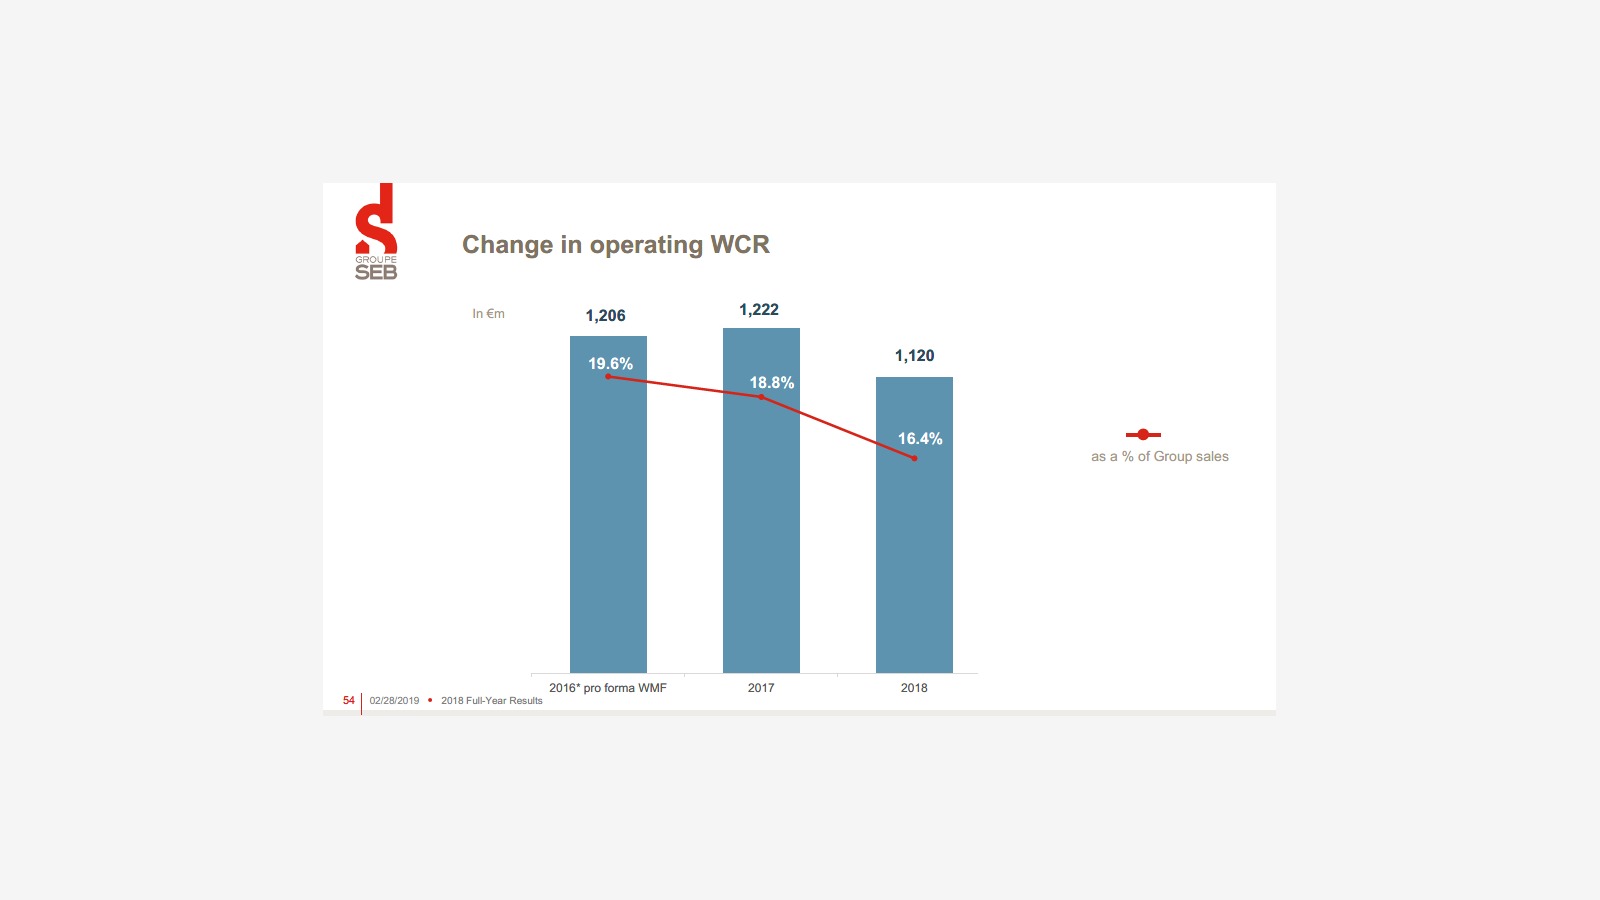
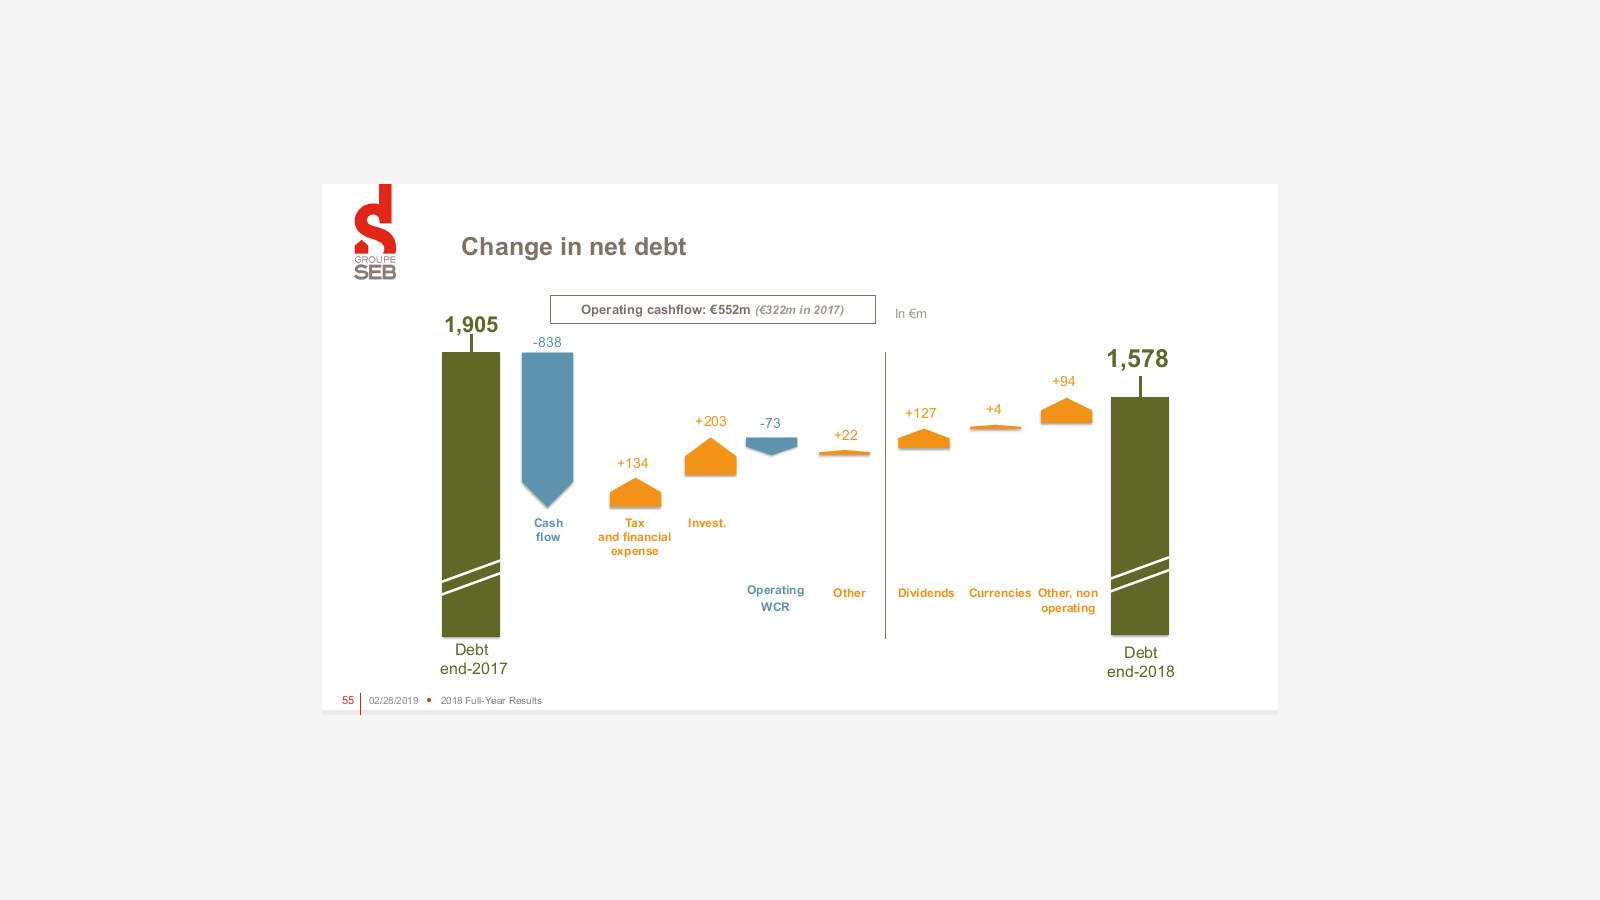
Changes in Liabilities
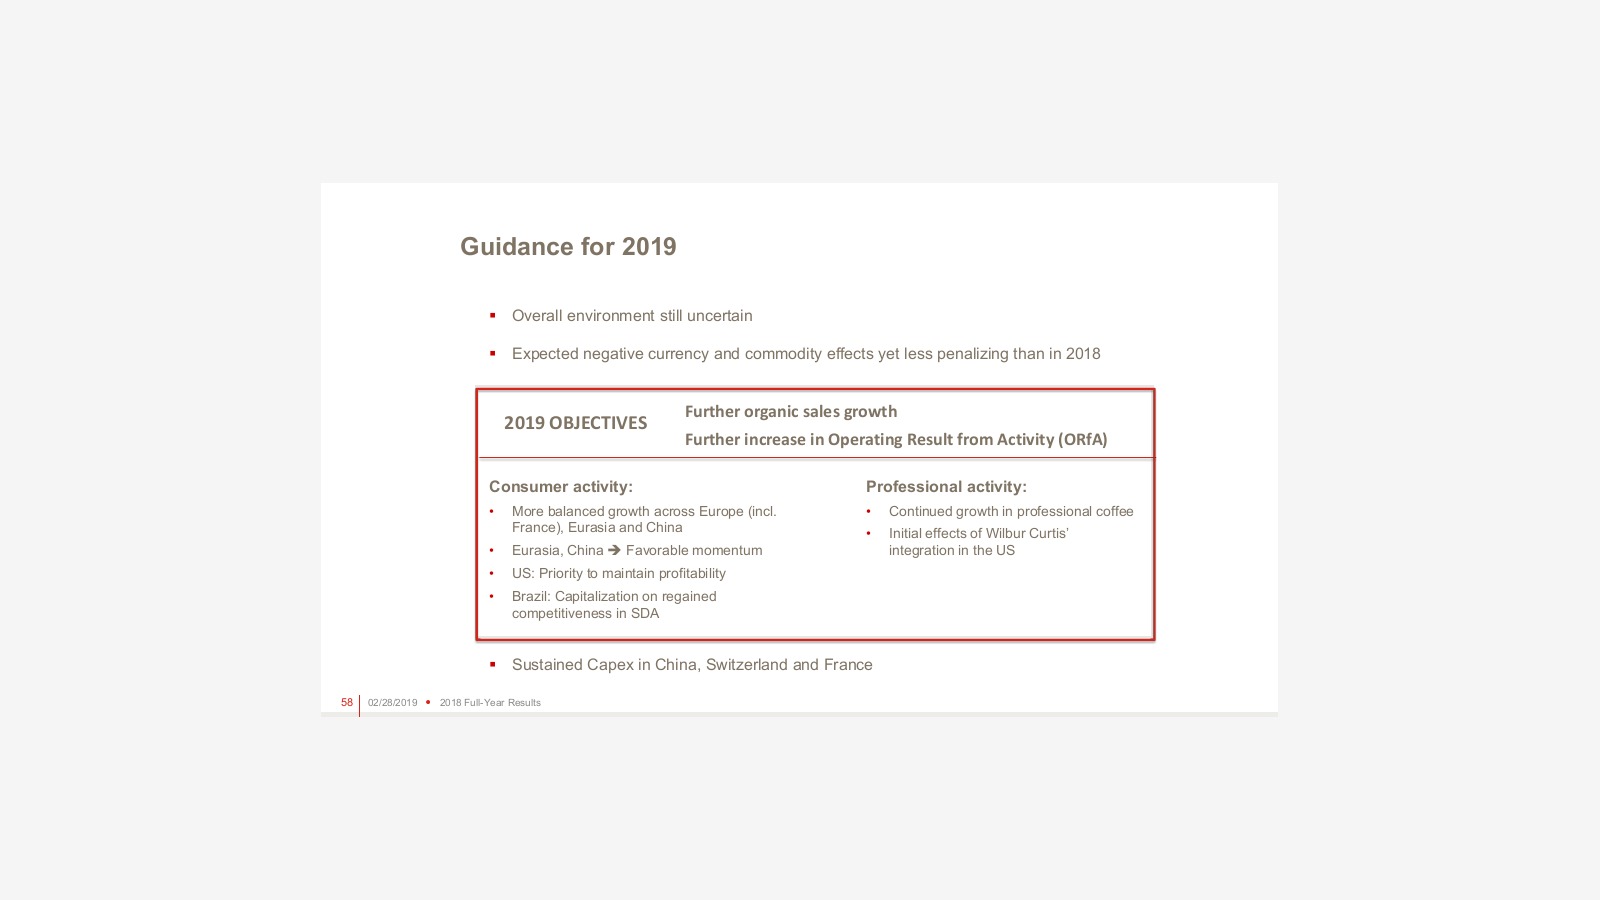
2019 Objectives:
Sales Breakdown by Quarter and Region for 2018